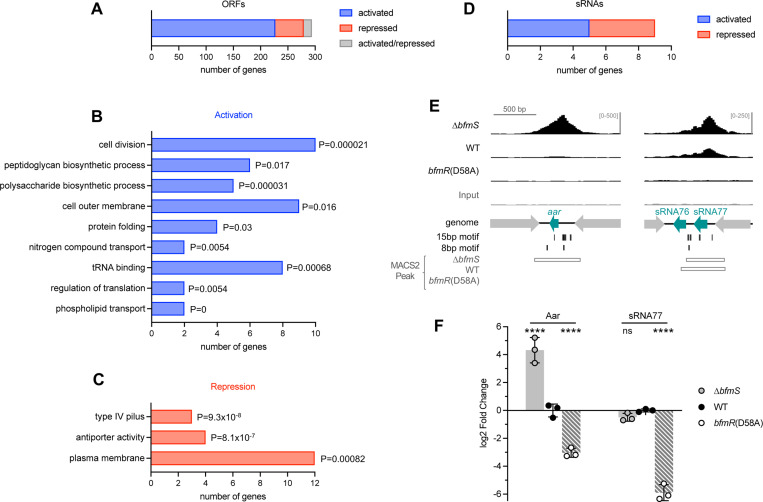
Fig. 10. Analysis of the BfmR direct regulon.
(A) Bar graph indicates the number of ORFs identified as direct targets of BfmR, with direction of regulation indicated by color. (B-C) GO term enrichment analysis of target ORFs directly activated (B) or repressed (C) by BfmR. A subset of the enriched GO terms and associated P-values (upper cumulative hypergeometric probability with Benjamini–Hochberg correction) are shown. (D) Bar graph shows the number of sRNAs identified as direct targets of BfmR activation or repression. (E) ChIP-seq reads aligning to the promoter regions of aar and sRNA77 are depicted as in Fig. 8. (F) Gene expression in stationary phase cultures of the indicated strain was measured by RT-qPCR. Data show geomean of log2 fold change (vs WT) ± s.d. (n=3). Differences between mutant and WT were evaluated by two-way ANOVA with Dunnett’s multiple comparisons test. ns, P>0.05; ****, P≤0.0001.

