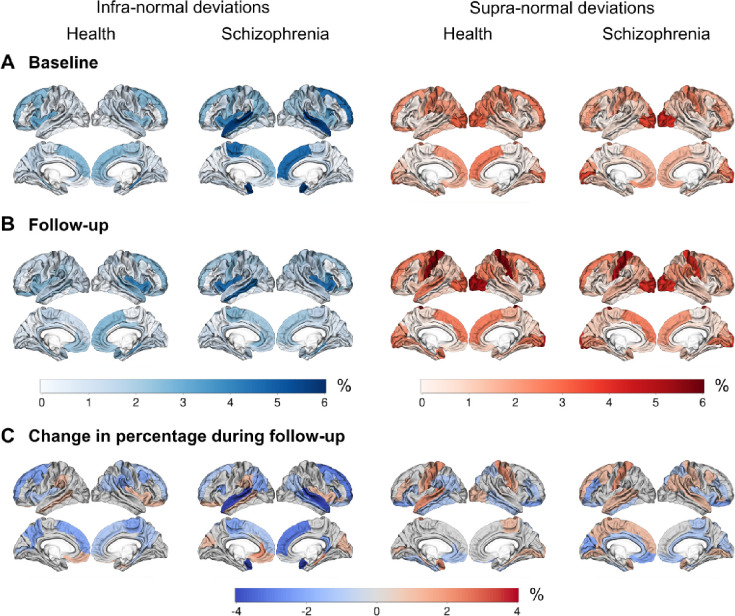
Figure E.
Cortical maps showing the percentage of individuals with infra- and supra-deviance morphometric similarity per region, A) at baseline, B) at follow-up, and C) the change in percentage during follow-up (i.e., percentage at follow-up - percentage at baseline). A negative percentage means that the regional percentage of individuals with infra- or supra-normal deviance decreased during follow-up.

