
Figure 5. Ank-G-GFP expression preserves axonal characteristics.
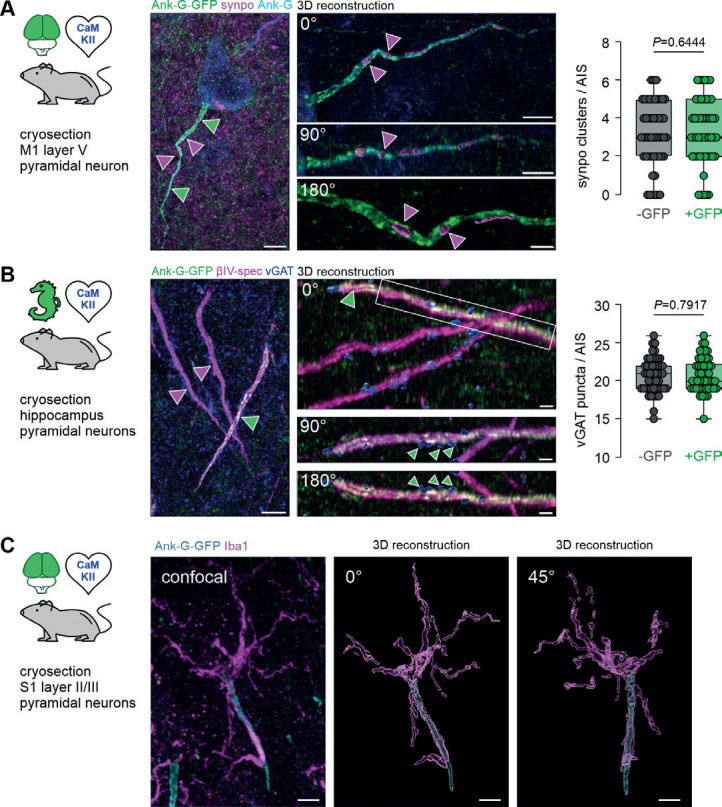
A Left: Representative image of a single layer V pyramidal neuron in M1 of an ank-G-GFP x CaMKII-Cre mouse with intrinsic ank-G-GFP (green), and colabeling against ankyrin-G (blue) and synaptopodin (synpo: magenta, arrows). Right: 3D-reconstruction of the AIS shown on the left. Three different rotations (0, 90, and 180°) of the same AIS indicate synpo clusters within the confinement of the axonal membrane of the AIS (magenta arrowheads). Scale bar left = 5 μm, right upper and middle panel = 5 μm, bottom panel = 2 μm. Quantification of synpo cluster number in AIS derived from ank-G-GFP x CaMKII-Cre mice showed no significant difference between GFP− and GFP+ AIS (n = 50 AIS from 3 animals, P = 0.6444, unpaired t-test). B Left: Representative image of three AIS of pyramidal neurons in CA1 of an ank-G-GFP x CaMKII-Cre mouse with intrinsic ank-G-GFP (green), and colabeling against vGAT (blue) and βIV-spectrin (magenta). The only ank-G-GFP+-AIS in this image is highlighted by a green arrowhead; ank-G-GFP− AIS are demarked by magenta arrowheads. Right: 3D-reconstruction of the GFP+ AIS shown on the left. Three different rotations (0, 90, and 180°) indicate vGAT clusters (green arrowheads) along the AIS where GABAergic synapses innervate the axon. Note that both ank-G-GFP+, as well as ank-G-GFP− AIS are contacted by vGAT puncta (blue). Scale bar left = 10 μm, right upper and middle panel = 5 μm, bottom panel = 2 μm. Quantification of vGAT-positive puncta along AIS derived from ank-G-GFP x CaMKII-Cre mice showed no significant difference between GFP− and GFP+ AIS (n = 50 AIS from 3 animals, P = 0.7917, unpaired t-test). C Left: Representative image of two AIS of layer II/III pyramidal neurons in S1 of an ank-G-GFP x CaMKII-Cre mouse with intrinsic ank-G-GFP (green), and colabeling against Iba1 (magenta), a marker for microglia. Right: 3D-reconstruction of the boxed region in the left panel. Two different rotations (0 and 45°) indicate that this AIS is contacted by at least one microglial process. Scale bar = 5 μm. GFP+ AIS were used for analysis.