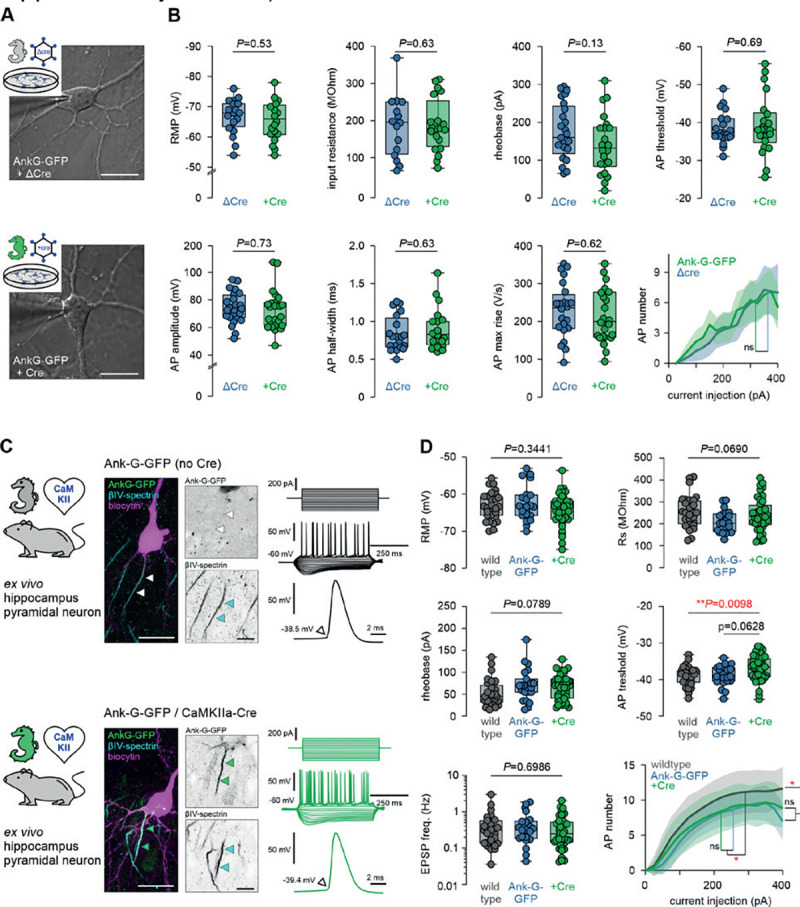
Figure 7. Neuronal excitability is not affected by GFP fusion to ankyrin-G.

A Representative images of a ΔCre control neuron (upper panel) and a +Cre neuron (lower panel) from dissociated hippocampal cultures with the patch pipette attached. Scale bar = 25 μm. B Analysis of active and passive electrophysiological membrane properties, all indicating no significant changes between experimental and control groups (one-way ANOVA, Holm-Sidak’s multiple comparison test. P-values are indicated in each graph, n = 25 ΔCre cells, 24 +Cre cells). C Representative images of a biocytin-filled (magenta) hippocampal pyramidal neuron from an ank-G-GFP control (upper panel) and an ank-G-GFP x CaMKII-Cre animal (lower panel), colabeled for βIV-spectrin (blue) with intrinsic GFP signal (green). The black & white panels highlight the individual AIS in each cell. Note that in the control neuron (upper), no GFP signal for the AIS could be detected (white arrowheads). Scale bar = 20 μm. Representative traces of AP trains elicited by current injection (250 ms, −200 to +250 pA) in control (upper panel) and ank-G-GFP x CamKII-Cre neurons (lower panel, green). D Analysis of RMP, Rs, AP rising phase, AP threshold, rheobase, and maximum AP number, all indicating no significant changes between experimental and control groups (one-way ANOVA and Tukey’s multiple comparisons test, or Kruskal-Wallis and Dunn’s multiple comparison test (non-parametric). P-values are indicated in each graph, n = 28 Ctrl cells, 23 ank-G-GFP cells, 42 ank-G-GFP x CamKII-Cre cells).
