
Figure 9. Live imaging of ank-G-GFP+-AIS in vivo.
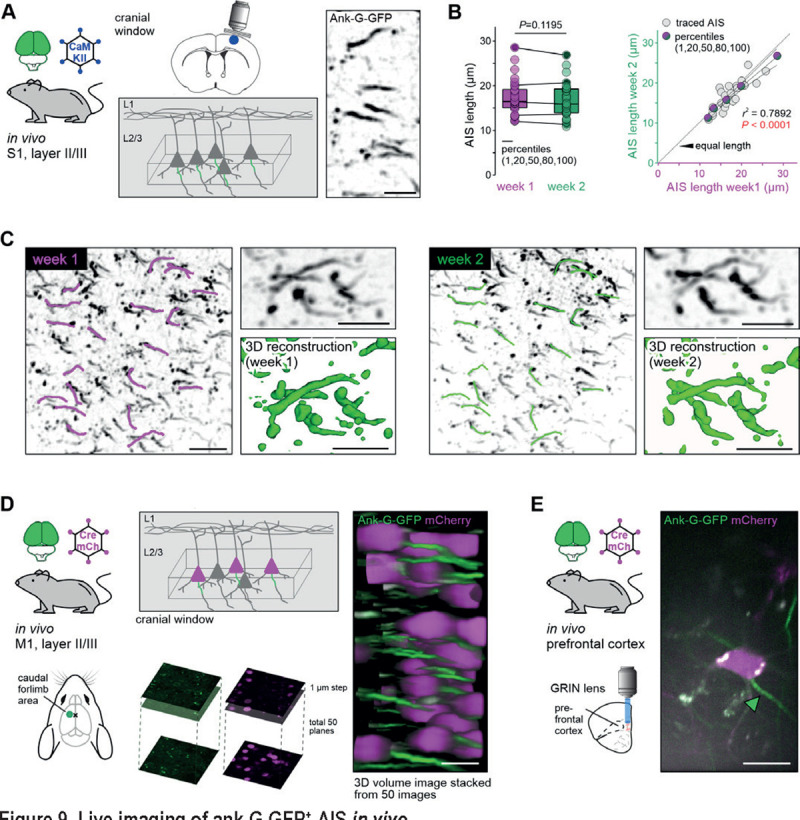
A Experimental setup: A cranial window was implanted in ank-G-GFP x CaMKII-Cre animals (2 animals, 3–4 months old). Imaging supragranular neurons in S1 layer II/III allowed for stable GFP-signal visualization (right panel, inverted GFP signal). Scale bar = 10 μm. B AIS length analysis from the same individual AIS one week apart showed no significant differences between the time points and ROI (paired t-test, P = 0.1195; n = 30 AIS). Linear regression analysis indicated a strong correlation between individual AIS length in the same neurons from week 1 (magenta) and week 2 (green; r2 = 0.7892, P < 0.0001, n = 30 AIS from one ROI and animal). C 2PM revealed a robust and stable GFP signal during the duration of the imaging session. Individual AIS were easily detectable and maintained their overall geometry over the chosen time course (insets with 3D reconstruction). Scale bar overview = 20 μm, close up = 10 μm. Left: ROI from week 1 imaging session. Magenta traces along individual AIS demark those subjected to length measurements. Right: The same ROI as in the left panel a week later, with the same AIS marked for length analysis (green). Scale bar = 20 μm. D Experimental setup: Ank-G-GFP animals were injected contralateral to the imaging site with a retrograde Cre-recombinase and mCherry-expressing AAV resulting in GFP expression at the AIS of mCherry-positive neurons in M1 (caudal forelimb area). Imaging via a cranial window revealed robust GFP signal in infected cells. 3D stacks were produced 150 – 200 μm from the dura mater; stacks were imaged with 1 μm intervals and 50 images merged into a volume. Scale bar = 20 μm. E Experimental setup: Ank-G-GFP animals were injected with a retrograde Cre-recombinase and mCherry-expressing AAV in the medial prefrontal cortex resulting in GFP expression at the AIS of mCherry-positive neurons in the basolateral amygdala. Imaging was performed through a GRIN lens and allowed for visualization of individual mCherry-positive neurons and their respective AIS (green arrowhead). Scale bar = 10 μm.