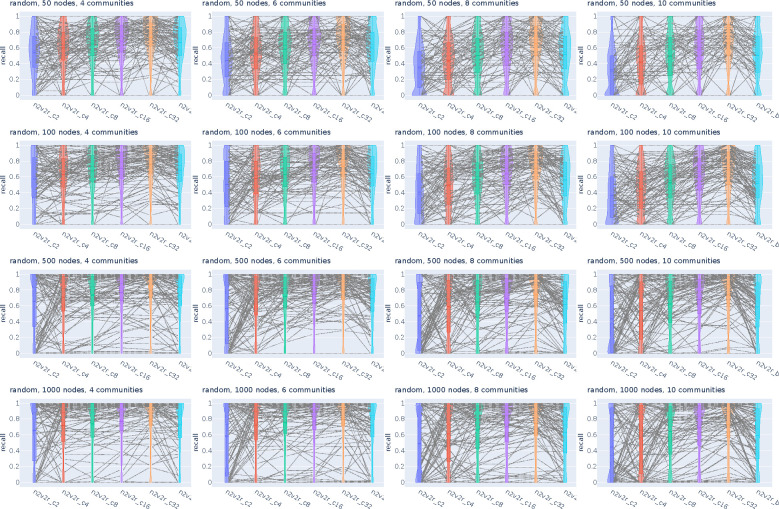
Figure A6:
Violin plots for recall in retrieving the top most different nodes between two graphs for cosine distance and increasing embedding dimensionality and Borda aggregation. We intervene by randomly changing the community probabilities of a single community and then updating the second adjacency matrix accordingly. We generate 2000 pairs of graphs by randomly applying this intervention and adding Gaussian noise. The goal is to retrieve the nodes of the intervened community as the top most changing. For a random subset of 100(5%) sampled graph pairs we connect the corresponding method recall estimates. The solid and dotted lines in the violins correspond to the median and mean, respectively.

