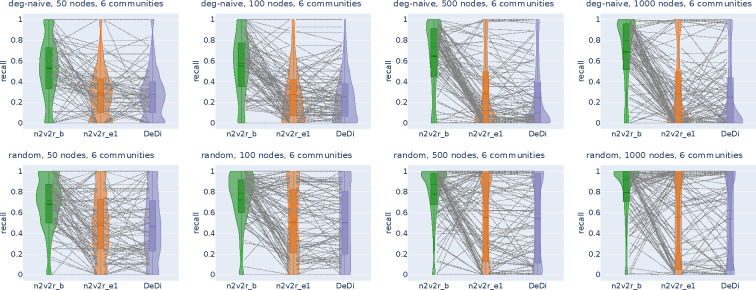
Figure 2:
Recall violin plots for retrieving the nodes of the communities with the largest changes between two graphs. The data follow a dynamic stochastic block model with six communities constructed such that the community probabilities vary between the two graphs. The first row corresponds to degree-naive differences, where we permute the probabilities of a community to simulate changing connections but not degree. The second row corresponds to random differences, where we randomly change the probabilities of a community. For each scenario, we generate 2000 pairs of graphs by randomly applying the interventions and adding Gaussian noise. The number of nodes increases along the columns. The goal is to retrieve the nodes of the intervened community. For a random subset of 100(5%) sampled graphs, we connect the corresponding recall estimates for all methods. The solid and dotted lines in the violins correspond to the median and mean, respectively. The three methods compared are the proposed Borda aggregated n2v2r_b, the one-dimensional n2v2r_e1 with Euclidean distance, and the degree difference ranking DeDi.

