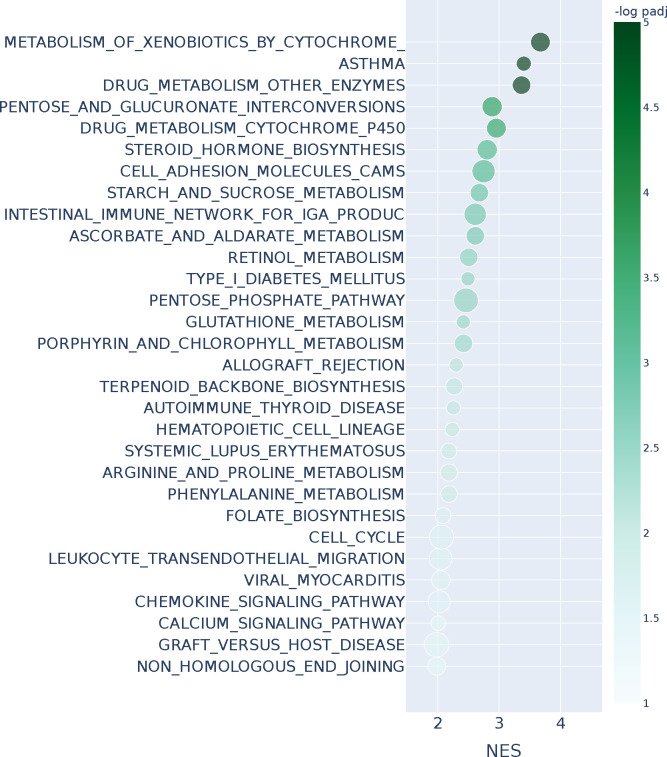
Figure A14:
Gene set enrichment analysis with KEGG and Kolmogorov–Smirnov test for the entire DESeq2 ranking on the LUAD TCGA cohort when comparing male with female patient gene expression. We present the top30 results ranked by adjusted p-values that pass a 0.1 FDR cutoff (equivalent to −log padj = 1).The x-axis represents the normalized enrichment score, and color the −log padj value. The size of the points indicates the overlap of the leading gene sets with the pathways. Long pathway names have been trimmed.

