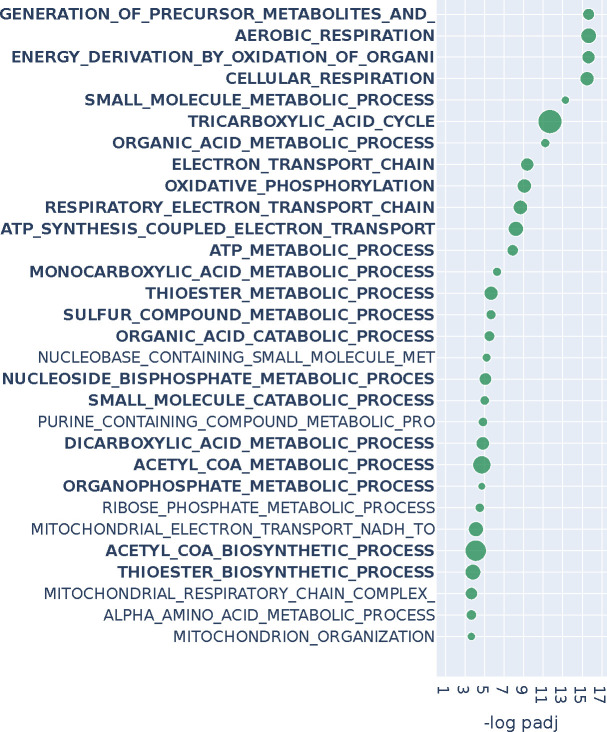
Figure 3:
Over-representation analysis with GOBP annotations for the top 2% of genes (roughly 500) of n2v2r on BRCA TCGA when comparing luminal A patients against matched adjacent normal samples using PANDA regulatory networks. We present the top 30 results ranked by adjusted p-values that pass a 0.1 FDR cutoff (equivalent to −log padj = 1). Bold indicates pathways common with DeDi when performing the same analysis. The size of the points indicates the overlap of the input gene set with the pathways. Long pathway names have been trimmed.

