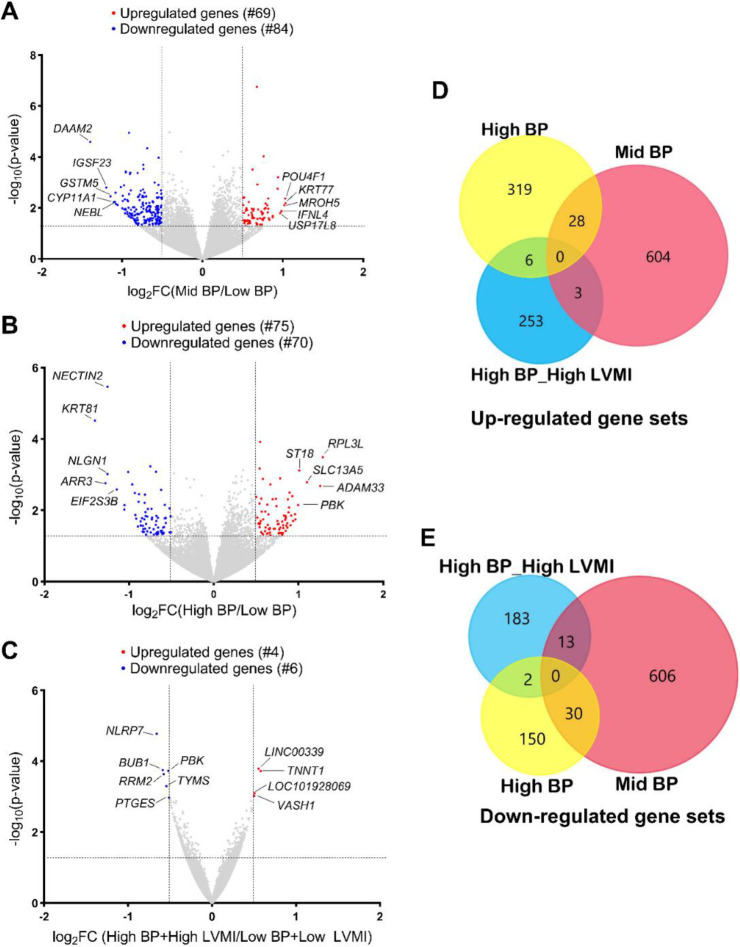
Fig. 1 |. RNA expression pattern in PBMCs from SHIP AHOY participants with mid-BP, high-BP and high-BP+high-LVMI.
Volcano Plot representing DEGs in mid-BP group (A), high-BP group (B), and high-BP+high-LVMI group (C) – each compared to their respective controls. RNAs with changes in expression and their p-value are determined by DEseq2 algorithm. The red color represents the increased gene expression, and the blue represents the diminished gene expression with p-value <0.05 and an absolute value of log2 fold change cut off 0.5. The top 5 up-regulated and down-regulated genes were labeled for each analysis. The upregulated and downregulated genes are compared among mid-BP, high-BP and high-BP+high-LVMI groups. D-E, Venn diagram showing the upregulated gene sets with a p-value <0.05 (D) and downregulated gene sets with a p-value <0.05 (E).
BP: Blood pressure; DEG: Differentially expressed genes; LVMI: Left Ventricular Mass Index; PBMCs: Peripheral blood mononuclear cells; SHIP AHOY: Study of High Blood Pressure in Pediatrics: Adult Hypertension Onset in Youth

