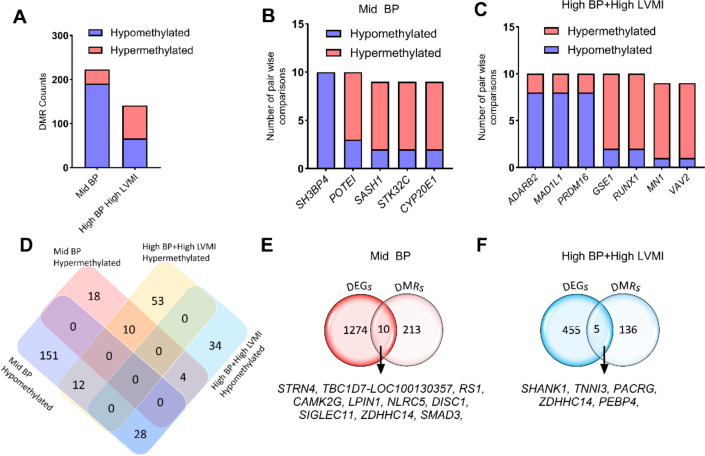
Fig. 6 |. Methylation pattern of whole genome DMRs and relation with RNA expression levels in SHIP AHOY participants with mid-BP and high-BP+high-LVMI.
A, Bar graph displaying the number of hypermethylated and hypomethylated DMR genes ranked based on their appearance in at least 6 pairwise comparisons in mid-BP (n=10), and high-BP+high-LVMI groups (n=10) each compared to low-BP+low-LVMI (n=10). B-C, Bar graph showing the hypermethylated and hypomethylated DMR genes that appeared in the maximum number of comparisons in the (B) mid-BP (n=10), and (C) high-BP+high-LVMI groups (n=10). D, Venn diagram showing the comparison of significant hyper- and hypomethylated DMRs between the mid-BP and high-BP+high-LVMI groups. E-F, Venn diagram comparing the DEGs and DMRS in mid-BP (E), and high-BP groups (F). DMRs are selected based on their significant difference in the All CpG average methylation rate of mid-BP and high-BP+high-LVMI samples in comparison to their low-BP+low LVMI samples with a p-value<0.05 (Fisher exact test). The DMRs are then ranked based on their appearance in the 10 pairwise comparisons; only those having a minimum of 6 comparisons were considered for further analysis.
BP: blood pressure; DEG: differentially expressed genes; DMR: differentially methylated region; LVMI: left ventricular mass index; SHIP AHOY: Study of High Blood Pressure in Pediatrics: Adult Hypertension Onset in Youth

