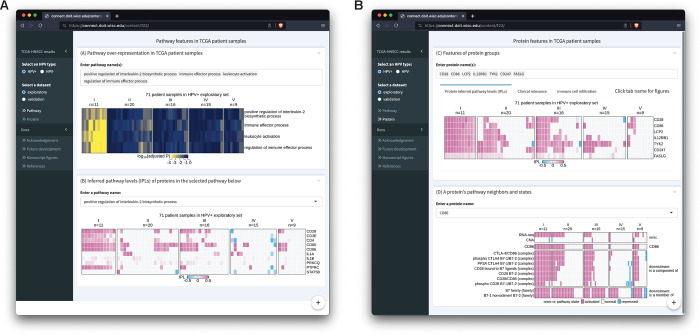
Figure 5. Screenshots of an R Shiny app displaying MPAC results from the HPV+ exploratory set.
(A)The upper panel shows enrichment of multiple user-selected pathways and the lower panel shows protein inferred pathway levels (IPLs) from a user-selected pathway; (B) The upper panel shows IPLs of multiple user-selected proteins and the lower panel shows the pathway states of a user-selected protein and its pathway neighbors as well as its CNA and RNA state.

