Fig. 2:
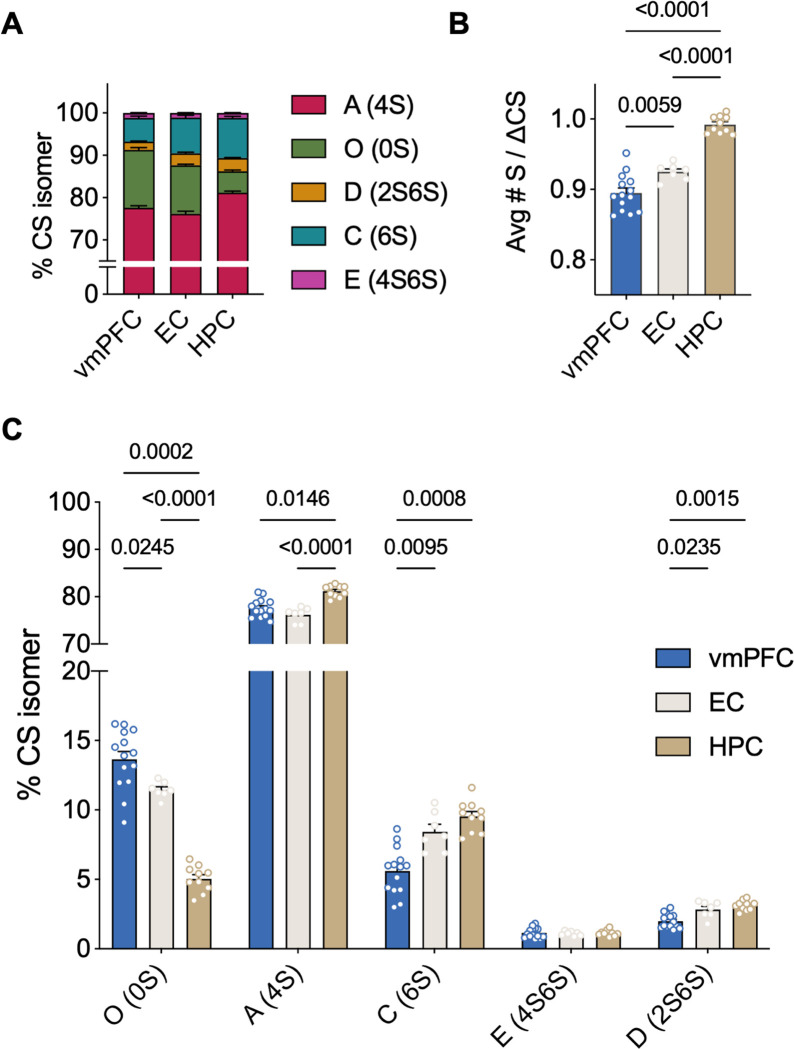
CS-GAG sulfation code varies significantly between brain regions in healthy postmortem human brain A Comparison of the relative abundance of each CS isomer in the control vmPFC (N = 14), EC (N = 7) and HPC (N = 10) measured by LC-MS/MS B The HPC is the most hypersulfated region on average while the vmPFC is the most hyposulfated region (Welch’s ANOVA: W(2,18) = 101, P < 0.0001, followed by Dunnett’s test) C Hypersulfation in the HPC is driven by mono-sulfated CS-A, -C and di-sulfated CS-D, while hyposulfation is driven by high abundance of CS-O in the vmPFC. Each isomer is expressed differently in each brain region except for isomer CS-E (4S6S) (ANOVA: isomer effect: F(2,61) = 20074, P < 0.0001; region effect: F(0.1, 10) = 5.478e-20, P > 0.9999; isomer × region: F(2,43) = 54.23, P <0.0001, followed by Tukey’s test). Avg#S/CS: average number of sulfates per chondroitin sulfate disaccharide, CS-GAG: chondroitin sulfate glycosaminoglycan, vmPFC: ventromedial prefrontal cortex, EC: entorhinal cortex, HPC: hippocampus, LC-MS/MS: liquid chromatography tandem mass spectrometry, ANOVA: analysis of variance.

