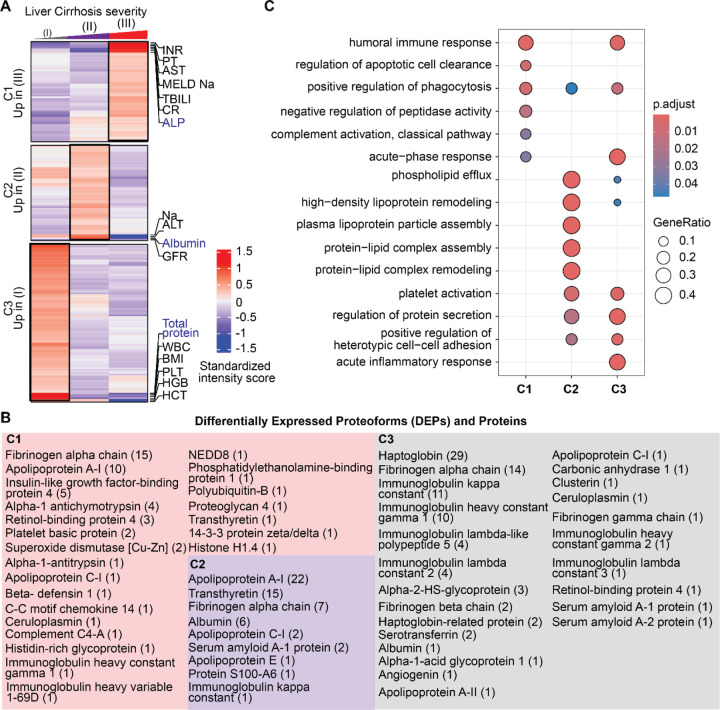
Figure 2. Proteoforms found to be differentially expressed across stages of cirrhosis.
A) Cluster distribution of differentially expressed proteoforms (DEPs) and currently used clinical markers of disease severity. Clinical markers highlighted in blue are significantly different between stages. Cluster 1 (C1) included DEPs upregulated in Stage III disease, C2 included DEPs upregulated in stage II disease, and C3 included DEPs upregulated in Stage I disease. B) Proteins from which DEPs derived are shown within each cluster. The number of proteoforms of a given protein is shown in parentheses beside the protein name. For example, in C1 the fibrinogen alpha chain protein had 15 DEPs identified. C) Biological process enrichment analyses on proteins identified in each cluster. The level of significance is represented by the color of the bar with scale while the gene ratio is indicated by the diameter of the circle.

