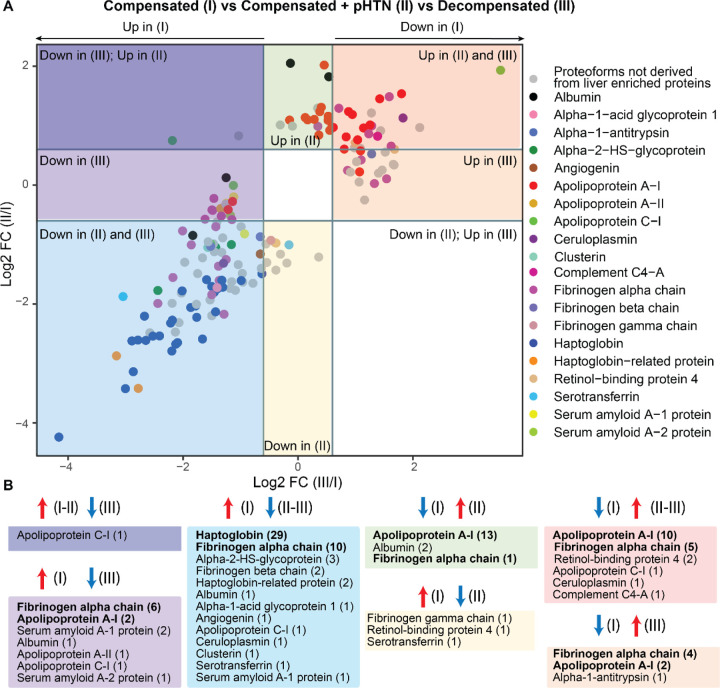
Figure 4. Display of proteoforms stratified by expression in each stage of cirrhosis.
A) Differentially expressed proteoforms (DEPs) in Stages II and III disease with Stage I disease (compensated) used as the reference. Proteoforms upregulated in Stage II and III (red square), upregulated only in Stage III (orange square), downregulated in Stages II and III (blue square), downregulated in Stage III only (light purple square), downregulated in Stage III but upregulated in Stage II (dark purple square), upregulated only in Stage II (green square), and downregulated only in Stage II (yellow square). Proteoforms deriving from proteins enriched in liver are highlighted and grouped by color according to the figure legend. B) Profiles of proteoforms upregulated in Stages I and II and downregulated in III (dark purple), upregulated in I and downregulated in III (light purple), upregulated in I and downregulated in II and II (light blue), downregulated in I and upregulated in II (green), upregulated in I and downregulated in II (yellow), downregulated in I and upregulated in II and III (red), and downregulated in I and upregulated in III (orange). The proteins from which DEPs derive and the relative number of proteoforms (in parenthesis) are shown. Proteins with the highest number of DEPs for each group are shown in bold.

