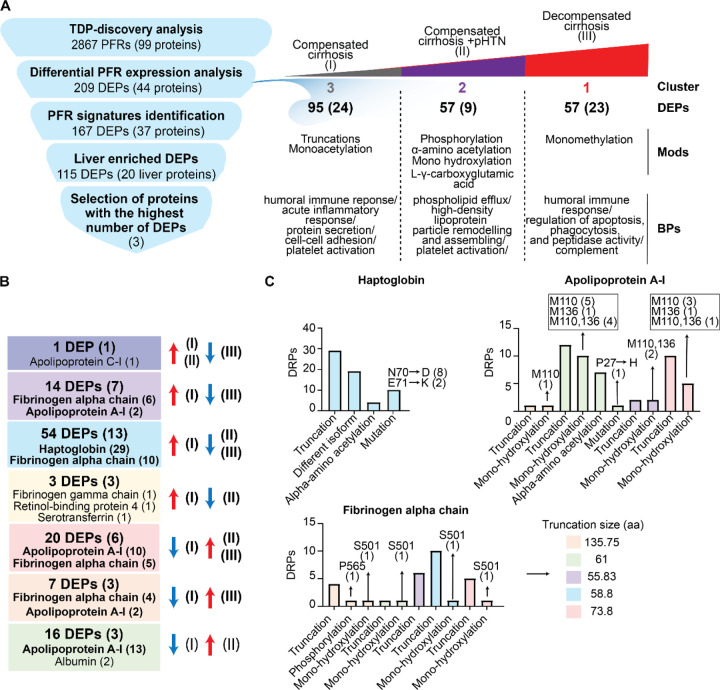
Figure 5. Summary of quantitative TDP analysis of plasma proteoforms in patients with cirrhosis.
A) Strategy used to identify potential candidate proteoform biomarkers of liver cirrhosis and summary of the differential PFR expression analysis. Differentially expressed proteoforms (DEPs) were classified in clusters based on their upregulation in 1) compensated cirrhosis (Stage I- Cluster 3), 2) compensated cirrhosis with portal hypertension (Stage II- Cluster 2), and 3) decompensated cirrhosis (Stage III- Cluster 1). For each cluster, the number of upregulated DEPs with their relative proteins (in parenthesis), modifications, and biological processes are reported. B) Composition of the identified liver derived DEP signatures. Proteins from which the DEPs derive are shown in parenthesis. Proteins with the highest number of DEPs for each group are also reported and shown in bold. DEPs are grouped by color based on their upregulation or downregulation in disease stages as performed in Figure 4. For example, in the red group 20 DEPs deriving from 6 proteins were upregulated in Stages II and III of the disease as compared to Stage I disease. 10 of these DEPs derived from apolipoprotein A-I and 5 derived from fibrinogen alpha chain. C) DEPs relative to Haptoglobin, Apolipoprotein A-I, and Fibrinogen alpha chain, which are the 3 plasma proteins with the highest number of detected DEPs, are reported together with their modifications. Colors indicate the signature groups in B and C. Abbreviations: PFR (proteoform), DEP (Differentially expressed proteoform), Mod (Modification) BP (biological process), aa (amino acids).

