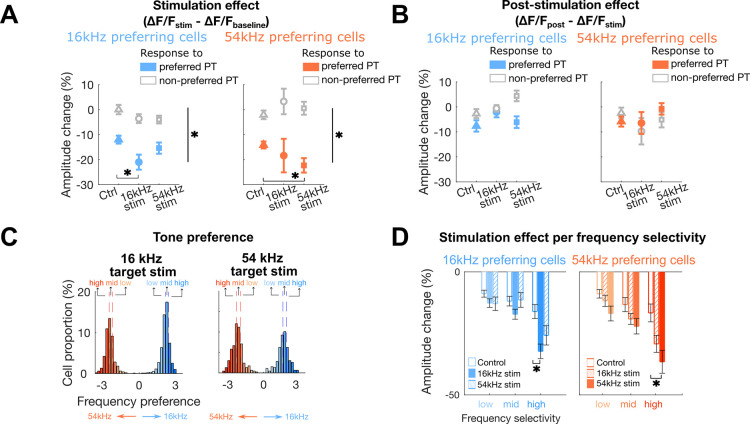
Figure 3. Non-target co-tuned cells show more decreased response amplitudes due to stimulation when synchronized with their preferred tones.
A: Stimulation effect () in 16 kHz (blue) and 54 kHz (orange) preferring cells. Both cell groups show decreased amplitude to their preferred frequency regardless of conditions due to acoustic stimulus-specific adaptation. Only co-tuned cells (16 kHz preferring cells for 16 kHz stimulation or 54 kHz preferring cells for 54 kHz stimulation) show a further decrease in response amplitudes due to the stimulation, when the preferred pure tone (PT) frequency was synchronized. Error bars indicate SEM across FOVs (*: p < 0.05). B: Post-stimulation effect () 16 kHz (blue) and 54 kHz (orange) preferring cells. No significant response amplitude changes were observed. Error bars indicate SEM across FOVs. C: Sub-categorization of cells based on the frequency selectivity for each target stimulation condition (left: 16 kHz stim, right 54 kHz stim). Cells were first grouped into either 16 kHz preferring cells (blue) or 54 kHz preferring cells (orange). Within each cell group, cells were further subdivided into low, mid, and high frequency selectivity categories based on their 33% quartile ranges. Note that the frequency preference was log-transformed for visualization, but the x-axis labels kept the original frequency selectivity values before transformation. Vertical dashed lines indicate 33% quartile ranges. D: Response amplitude change based on the frequency selectivity category for each cell groups (blue: 16 kHz preferring cells, orange: 54 kHz preferring cells). Significant response amplitude changes relative to the control condition were observed only for high frequency selectivity category when target stimulated cells were co-tuned (*: p < 0.05).

