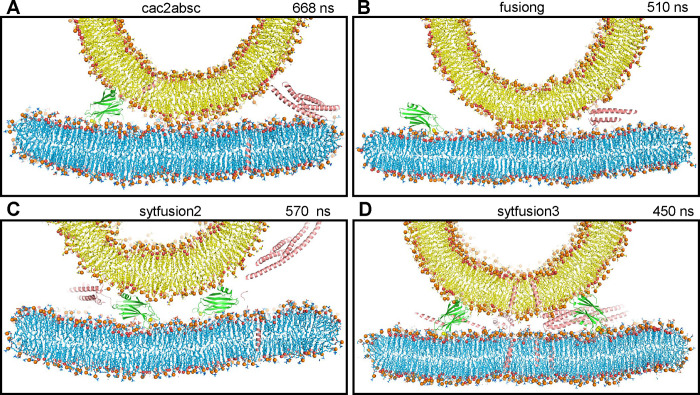
Figure 1.
The Syt1 C2 domains hinder SNARE action when located near the site of fusion. (A-D) Diagrams showing thin slices of frames taken at 668 ns of the cac2absc simulation (A), 510 ns of the fusiong simulation (B), 570 ns of the sytfusion2g simulation (C) and 450 ns of the sytfusion3 simulation (D). Lipids are shown as stick models with nitrogen atoms in dark blue, oxygens in red, phosphorus in orange and carbon atoms in yellow (vesicle) or light blue (flat bilayer). Phosphorous atoms of phospholipids and the oxygen atoms of cholesterol molecules are shown as spheres to illustrate the approximate locations of lipid head groups. Proteins are represented by ribbon diagrams, with SNARE complexes in salmon color, Syt1 C2A domain in slate blue and Syt1 C2B domain in green. Ca2+ ions are shown as yellow spheres. Note that, because the slices shown are thin, only portions of some of the proteins, if any, are seen in the slices. The same color-coding was used in all the figures except when noted otherwise.

