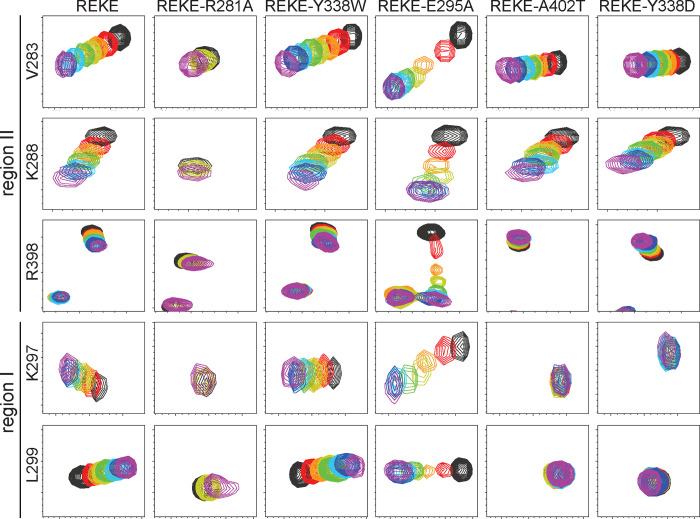
Figure 4.
The Syt1 C2B domain still binds to the SNARE complex through region II of the primary interface when binding through region I is abolished. The diagrams show expansions of 1H-15N TROSY HSQC spectra of 15N-C2B domain mutants (as indicated above) acquired in isolation (black contours) or increasing concentrations of CpxSC (rainbow colours). The residues corresponding to the cross-peaks shown in the expansions and the regions where they are located are indicated on the left. The following concentrations of 15N-C2B mutant and CpxSC (μM/μM) were used for the different mutants (from black to purple): REKE 32/0, 30/10, 28/19, 26/28, 24/36, 20/51, 17/64, 12/85; REKE-Y338W 32/0, 30/10, 28/19, 26/28, 24/36, 20/53, 17/67, 12/88; REKE-E295A 32/0, 30/10, 28/19, 26/28, 24/36, 20/53, 17/65, 12/88; REKE-A402T 32/0, 30/10, 28/19, 26/28, 24/36, 20/53, 17/67, 12/88; REKE-Y338D 32/0, 30/10, 28/19, 26/28, 24/36, 20/53, 17/68, 12/88. For the REKE-R281A mutant the concentrations were 32/0 (black), 26/28 (yellow) and 13/98 (purple). The intensities of cross-peaks decreased as CpxSC was added because 15N-C2B was diluted and binding to CpxSC causes cross-peak broadening. Contour levels were adjusted to compensate for these decreased intensities, but after doing comparable adjustments for the spectra of the REKE-E295A mutant the cross-peaks in the middle of the titration are still very weak because of chemical exchange broadening.

