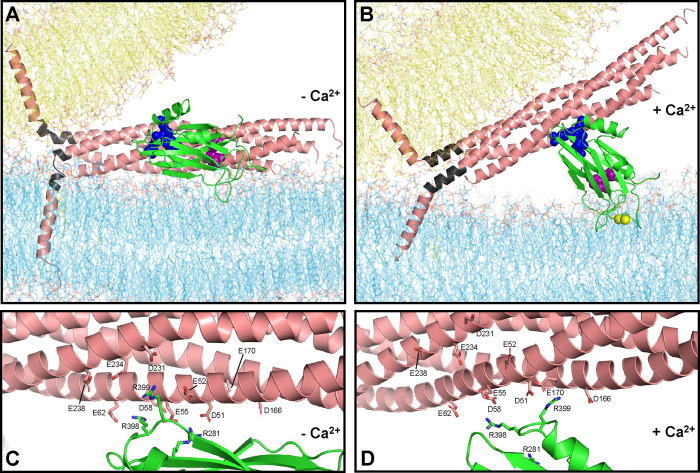
Figure 5.
Lever hypothesis of Syt1 function. (A) Model of the primed state before Ca2+ influx. Lipids are shown as stick models with the same color coding as in Fig. 1. The SNARE complex is represented by a ribbon diagram in salmon color except for the jxt linkers, which are colored in dark gray. The Syt1 C2B domain is represented by a green ribbon diagram with key residues at the primary interface shown as spheres: E295 and Y338 (region I) are in magenta; R281, R398 and R399 (region II) are in blue. The SNARE complex, flat bilayer and vesicle configurations were extracted from one of the frames of the fusion2g simulation described in (15) to illustrate a potential configuration of the primed state. The C2B domain was placed at a location analogous to that in one of the primed complexes at the end of the s1action2 simulation. The Syt1 C2A domain and complexin are also part of the primed state but are not shown for simplicity. (B) Model of a potential Ca2+-activated state built manually in Pymol using the configuration of panel (A) as starting point, rotating the C2B domain to an approximately perpendicular orientation with respect to the flat bilayer that mimics the plasma membrane, as observed by EPR (54), and moving the SNARE four-helix bundle to keep ionic interactions of the SNARE acidic residues with the arginines of region II of the C2B domain. The synaptobrevin and syntaxin-1 jxt linkers were modeled as helices that extend from the four-helix bundle based on the crystal structure of the SNARE complex (77), and the TM regions were pulled toward the polar membrane-membrane interface to maintain the continuity of the polypeptide chains. Ca2+ ions are shown as yellow spheres. (C, D) Close-up views of the primary interface in panel (A) and (B), respectively, showing the C2B arginines and SNARE acidic residues as stick models to show the interactions between these residues in the proposed initial configuration and in one of many potential configurations of the Ca2+-activated state.

