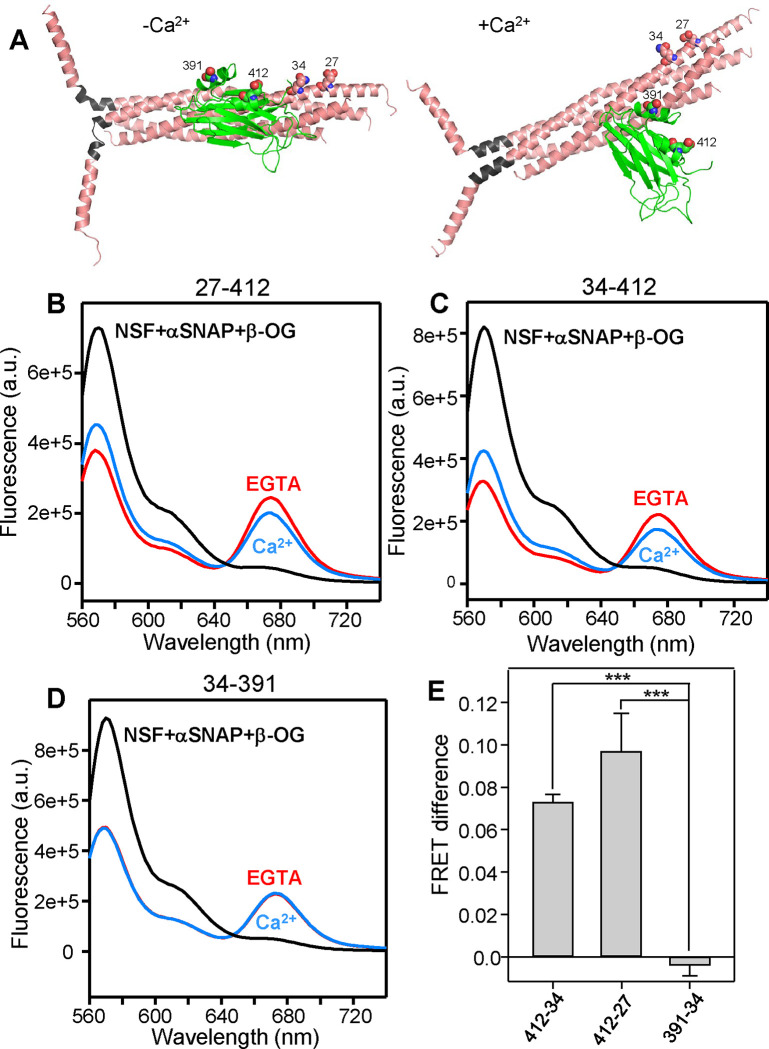
Figure 6.
Ca2+ induces reorientation of the Syt1 C2B domain with respect to membrane-anchored SNARE complex. (A) Models of the Syt1 C2B domain-SNARE complex in the primed state before Ca2+ influx and in a potential Ca2+-activated state, analogous to those of Fig. 5A,B and with the same color code. Residues of C2B and SNAP-25 that were mutated to cysteines to attach fluorescent probes are shown as spheres and labeled with the residue number. In these models, the following changes are predicted for the distances between the approximate points of attachment of the fluorescent probes in the absence or presence of Ca2+: SNAP-25 Q34 CD carbon - Syt1 E412 CD carbon from 34 Å (−Ca2+) to 48 Å (+Ca2+); SNAP-25 E27 CD carbon - Syt1 E412 CD carbon from 41 Å (−Ca2+) to 52 Å (+Ca2+); SNAP-25 Q34 CD carbon - Syt1 E391 CB carbon 31 Å (−Ca2+) to 28 Å (+Ca2+). Note that there is a large uncertainty in the distance changes because the configuration of the Ca2+-activated state is unknown and the 27–412 and 34–412 distances depend strongly on the angle of rotation (Supplementary Discussion). (B-D) Fluorescence spectra of liposome-anchored C2AB-SNARE-complexin-1 complex with stabilized Cy3 and Cy5 probes attached to the following residues of SNAP-25 and the C2B domain, respectively: 27–412 (B), 34–412 (C) and 34–391 (D). The spectra were obtained in the presence of Mg-ATP plus 1 mM EGTA (red curves), 1 mM Ca2+ (blue curves) or 1% β-OG plus NSF and αSNAP as a control to disrupt the Syt1-SNARE complex (black curves). In the experiments of (B-D), Mg-ATP was included in the samples to hinder non-specific C2AB-SNARE complex interactions (47). (E) Quantification of the FRET difference between the spectra obtained in 1 mM Ca2+ and 1 mM EGTA normalized with the FRET observed in the presence of 1 mM EGTA. Bars represent mean values and error bars represent standard deviations from experiments performed at least in triplicate. Statistical significance and p values were determined by one-way analysis of variance (ANOVA) with the Holm-Sidak test (*** p < 0.001).

