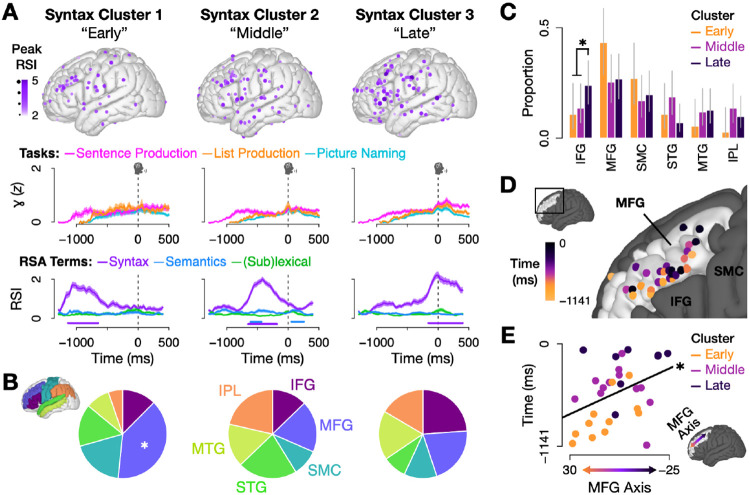
Fig. 4.
(A) Temporal clusters of electrodes with significant syntax RSIs (p < .05 for 100 ms, permutation test). Columns contain data from only electrodes in each cluster. Top row: Electrode localizations in each of the three clusters; color and size correspond to each electrode’s peak syntax RSI value. Middle row: Weighted mean and standard error of high gamma activity by experimental task (weighted by NMF weights). Bottom row: Weighted mean and standard error of the three RSIs; bars denote significance per term (p < .05 for 100 ms, permutation test). (B) ROI representation by cluster, scaled by each ROI’s representation in the original dataset (i.e., the chance distribution is 6 equal slices). MFG was significantly overrepresented in the Early cluster compared to the original distribution (p = .012, binomial test); no other regions survived multiple comparisons corrections. (C) Proportion of electrodes in each region of interest by cluster (error bars: 95% confidence intervals, Wilson score). Comparing across clusters, there was a significant increase in IFG electrodes in the Late cluster relative to the the Early and Middle clusters (padj. = .040, binomial test) and a marginally significant increase in STG electrodes in the Middle cluster relative to the Early and Late clusters (padj. = .053, binomial test). (D) Significant syntax electrodes in MFG, colored by the time when the syntax RSI peaked (median latency from stimulus to speech was 1141 ms). (E) Electrodes’ peak syntax RSI time was significantly predicted by position along the main axis of MFG (p = .027, linear regression) (only including MFG electrodes with significant syntax RSIs). Electrode position was calculated by projecting electrodes onto the main axis of MFG, which was the first principal component of the y and z MNI coordinates for MFG electrodes (see arrow on brain).

