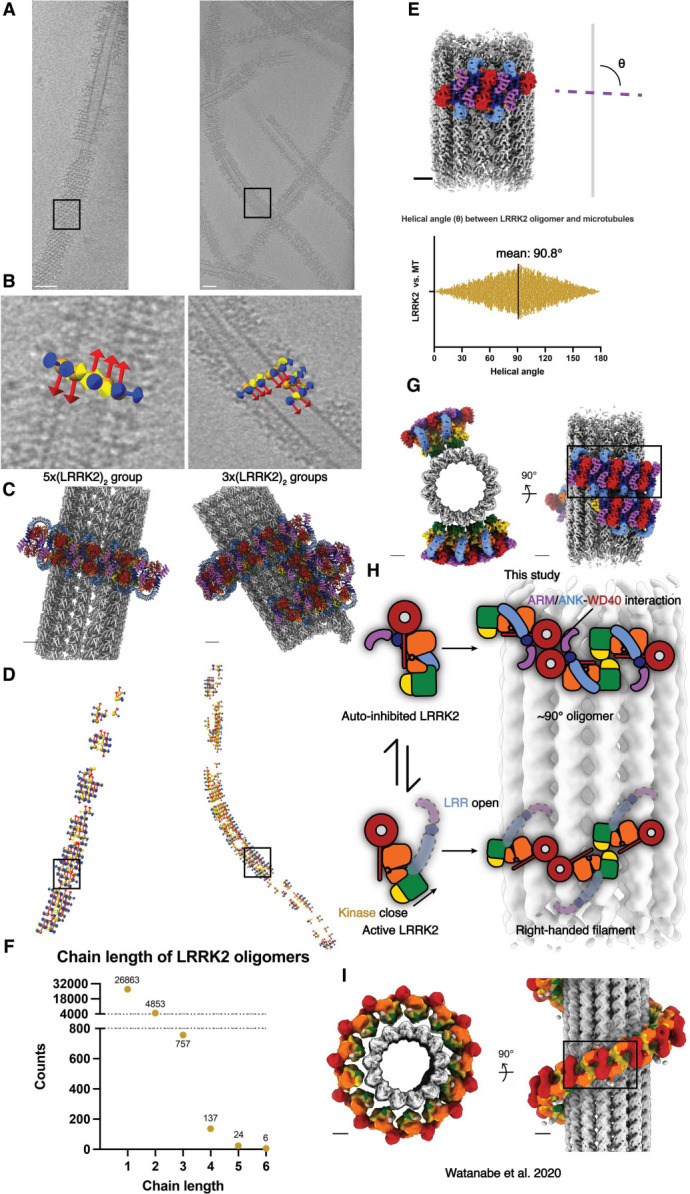
Figure 3. Autoinhibited LRRK2 forms short, sparse oligomers perpendicular to the microtubule axis.

(A) Tomographic slices 4.6 nm in thickness showing LRRK2 decorated microtubules. (B) Close-up views showing subtomogram coordinates (orange spheres) and their refined x-y-z (yellow-red-blue) orientations after subtomogram analysis. The picked subtomograms are mapped back to the original tomogram, and the LRRK2 dimer groups containing different copy numbers are shown (left: 5-copy group, right: several 3-copy groups clustering together). Black squares in (A) and (D) highlight the locations of corresponding subtomogram groups. (C) Composite model showing LRRK2 oligomer groups binding to microtubules, with orientations and LRRK2 copy numbers corresponding to (B). (D) Location and orientation of picked subtomograms contributing to the final LRRK2 reconstruction, color-coded in the same way as in (B). The subtomogram picking models are aligned to their corresponding microtubules in (A). (E) Representation of the definition of the helical angle (θ angle), showing the angle between (LRRK2)2 oligomers and the axis of the microtubule (above), as well as the plot showing the distribution of θ angles observed from this dataset (below). (F) Picked LRRK2 subtomograms are grouped based on their relative positions and distances, and the length of (LRRK2)2 oligomers grouped together are plotted as a frequency plot. The longest LRRK2 dimer chain observed in this dataset contains six LRRK2 dimers. (G-I) Summary of the comparison between the autoinhibited LRRK2 state observed from this study (G) and the active-like LRRK2 state observed from the in situ study (I) on microtubules. The cartoon representations in (H) describe the differences of the domain architectures between the autoinhibited and the active-like LRRK2, as well as the corresponding different assemblies observed on microtubules. In situ model of active LRRK2 forming right-handed filaments is derived from the published maps, with color codes matching all previous figures. Scale bars: (A) 50 nm, (B-I) 5 nm.
