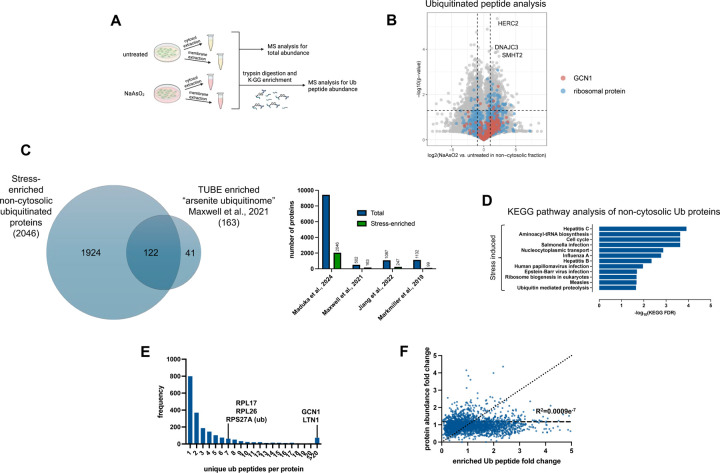
Figure 2. Ubiquitin targets non-cytosolic stress response factors in response to arsenite.
2A – Schematic of sample preparation for ubiquitin peptide proteomic analysis during arsenite stress.
2B – Volcano plots showing enrichments under arsenite stress of ubiquitin peptides in the non-cytosolic fractions. Peptides for GCN1 and various ribosomal proteins are highlighted, as well as top ubiquitinated peptides.
2C – Venn diagram and coverage of total proteins and those enriched under arsenite stress from ubiquitin proteomics dataset compared to Maxwell et al. 2021, Jiang et al. 2023, and Markmillan et al. 2019.
2D – KEGG pathway enrichment of proteins from ubiquitin peptides enriched in the non-cytosolic fraction under arsenite stress (fold change > 3 and q-value < 0.05).
2E – Frequency of proteins by the number of unique di-glycine peptides detected in the non-cytosolic fraction under stress.
2F – Correlation plot of fold changes of ubiquitin peptides with the fold change of the abundance of their corresponding proteins.

