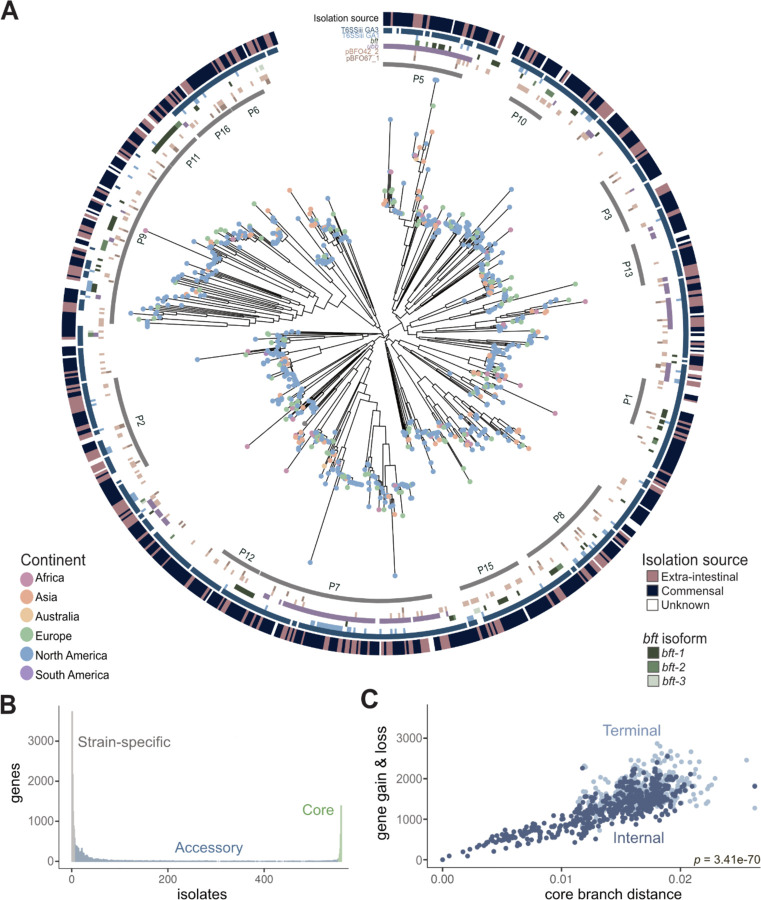
Figure 1. Pangenomic analysis of Bacteroides fragilis strains reveals extensive genetic variation.
A) A core genome alignment-derived phylogenetic tree of B. fragilis strains by maximum-likelihood annotated with continent of isolate origin (located as dots at the tips), specific phylogroup clusters indicated by the gray inner ring, genetic regions of interest (the six colored rings which signify Type VI secretion system (T6SS) GA1 and GA3, pBFO42_2 and pBFO67_1, plasmid; ubb; bft, B. fragilis toxin with the three isoforms as separate shades of green (n=813; p-value of PERMANOVA of anatomic site = 0.133; p-value of PERMANOVA of geography = 0.087) with the anatomic site of isolation coloring the outermost ring.
B) The number of genes that are strain-specific (in less than 1% of isolates), accessory (between 1% and 99% of isolates), or core (in more than 99% of isolates) in the B. fragilis pangenome of 813 strains.
C) A measure of core compared with accessory genome evolution through cumulative gene gain/loss events (accessory genome) versus cumulative phylogenetic branch distance (core genome) (Student’s t-test, p = 3.41e-70), colored by terminal (light blue) and internal branches (dark blue) using the Panstripe algorithm (Tonkin-Hill et al., 2023).

