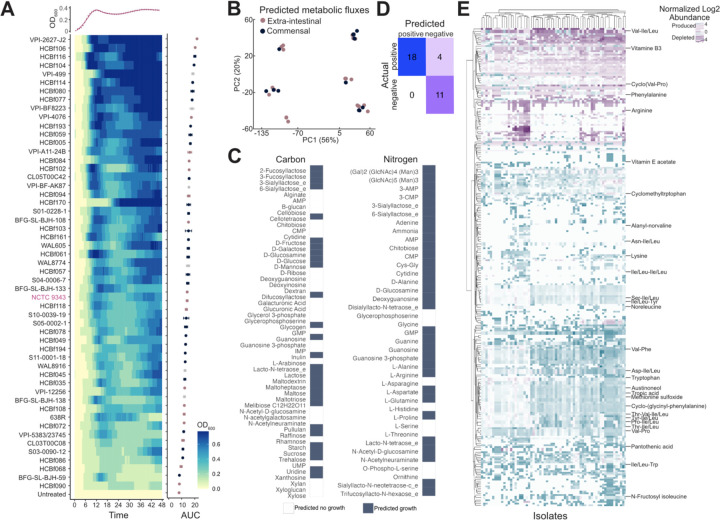
Figure 4. Growth and metabolic profiles of B. fragilis strains.
A) Growth of B. fragilis strains over time and normalized to untreated wells, as indicated by OD600. Data is displayed as a heatmap, with a representative growth curve for NCTC 9343 overlaid above. Strains are ordered according to descending area under the curve (AUC). Data represents the AUC ± SEM, with the mean across three individual experiments. AUC coloring by extra-intestinal (pink), commensal (blue), and unknown (grey).
B) PCA score plot of predicted metabolic fluxes, colored by commensal (blue) versus extra-intestinal (pink) strains.
C) Defined carbon and nitrogen sources colored by growth (blue) or no growth (white) predicted for any B. fragilis strain.
D) Predicted versus true growth of strains in defined nitrogen and carbon sources.
E) Heatmap of differentially abundant metabolites compared to a media control, metabolites with annotation are labeled, hierarchical clustering of metabolites by row and strains by columns. Benjamini-Hochberg adjusted p ≤ 0.05 and log2-fold change ≥ 0.25; n of metabolites = 278; n of strains = 93.

