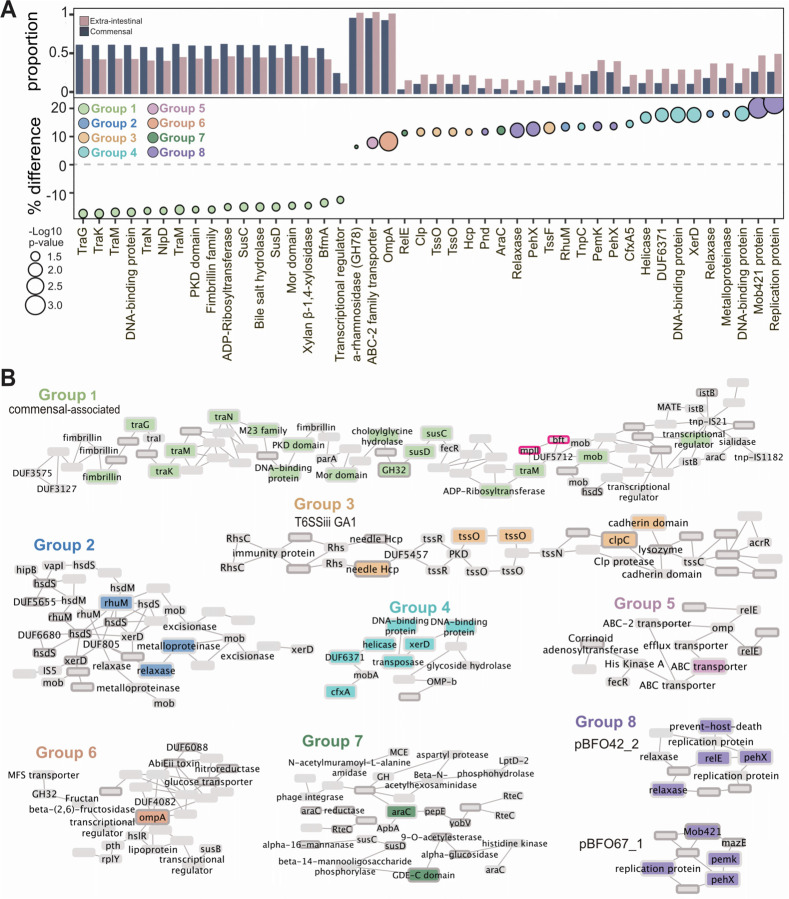
Figure 5. Extra-intestinal strains have genetic features associated with their isolation site.
A) Genes identified through gene presence/absence mGWAS as differentially present in commensals versus extra-intestinal strains (dark blue, commensal; pink, extra-intestinal strains; Holm’s adjusted p≤0.05). Y axis is proportion of commensal or extra-intestinal strains with that gene as well as the percent difference in prevalence in commensal versus extra-intestinal strains. Size represents the −log10 p-value and color of each gene cluster determined by location on a pangenome graph, n=510 which excludes all metagenome assembled genomes (MAGs).
B) Graphical representation of genes in the context of the pangenome in eight gene clusters. Group 1, commensal associated; Groups 2–7, extra-intestinal associated. The black border indicates genes which are predicted to be acquired through horizontal gene transfer (HGT). The pink border is highlighting the gene encoding the B. fragilis toxin, bft.

