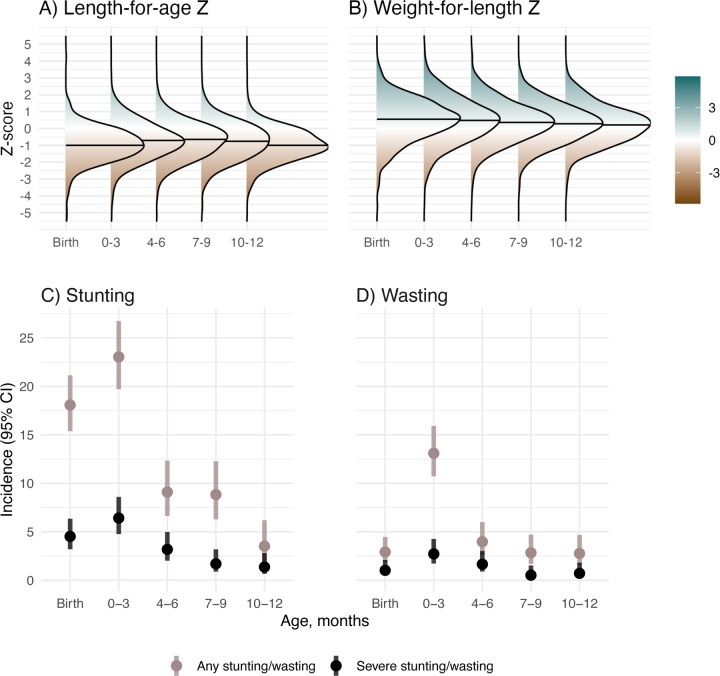
Figure 1. Child growth from birth through 12 months.
0–3 includes children aged 1 day to 3 months, 4–6 includes children aged >3 to 6 months, 7–9 includes children aged >6 to 9 months, and 10–12 includes children aged >9 to 12 months. In A) and B) horizontal lines in each density plot indicate the median Z-score for each age category.

