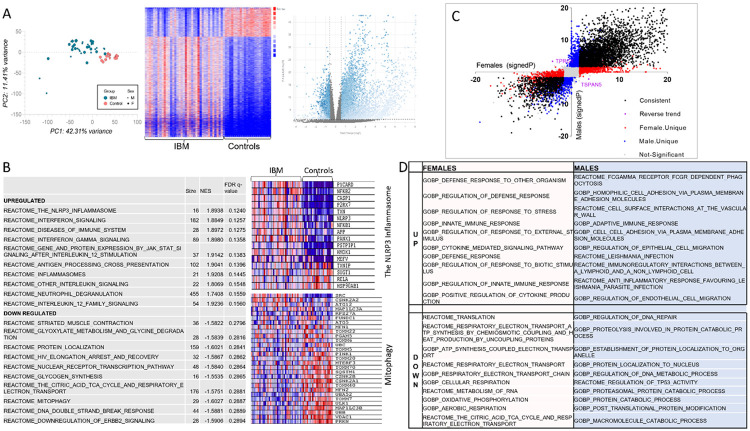
Figure 1: IBM transcriptome.
Transcriptomic analysis of muscle tissue from 38 patients with inclusion body myositis and 22 controls. A) PCA (to the left) and heat map (middle) showing clear separation between IBM patients and controls. Volcano plot (to the right) representing differentially expressed genes (blue). B) Top 10 upregulated and top 10 downregulated pathways in IBM. The NLRP3 inflammasome and mitophagy pathways are detailed in the heatmaps with downregulated genes shown in blue and upregulated genes shown in red. Transcriptomic sex differences are shown in C&D. C) Volcano plot showing the signed −log10(p value) for each gene in females on the x axis and in males on y axis. Differentially expressed genes that are consistent in both sexes are shown in black, female-unique genes are shown in red, male-unique genes are shown in blue, and genes with reverse trends are shown in purple. Genes that did not reach fold change or p-value cutoffs in either sex are shown in gray (not significant). D) The top 10 upregulated and downregulated pathways for sex-specific genes.

