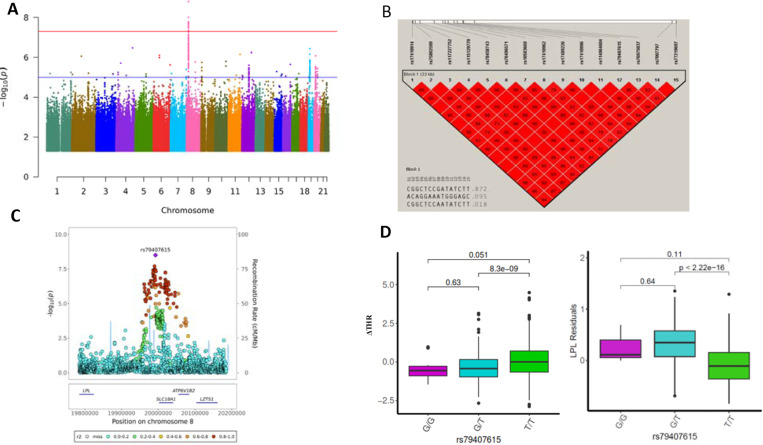
Figure 1. GWAS results of ΔTHR using whole genome sequenced autosome variants.
A) The Manhantan plot for GWAS results of ΔTHR across 22 chromosomes. P values are two-sided raw P values estimated from a linear additive model. The y-axis depicts the negative log10-transformed P value. The x-axis is genomic coordinates by chromosome number. The blue-colored solid horizontal line denotes the suggestive threshold (p=1e-5). The red-colored solid horizontal line indicates the genome-wide significant cutoff at p=5e-8.
B) The LD heatmap of 15 significant SNPs at chromosome 8 that reached genome-wide significance using Haploview. The value displayed is LD r2.
C) The Locuszoom plot of ± 200 Kb of lead SNP rs79407615 at chromosome 8. The x-axis is the base pair position in the genome build GRCh38 at chromosome 8. The y-axis is the –log10 of the two-sided P value for each genetic variants.
D) The box and whisker plot for the ΔTHR and the LPL residuals across three genotypes of rs79407615. The pairwise comparison P value is estimated using wilcox.test in R.

