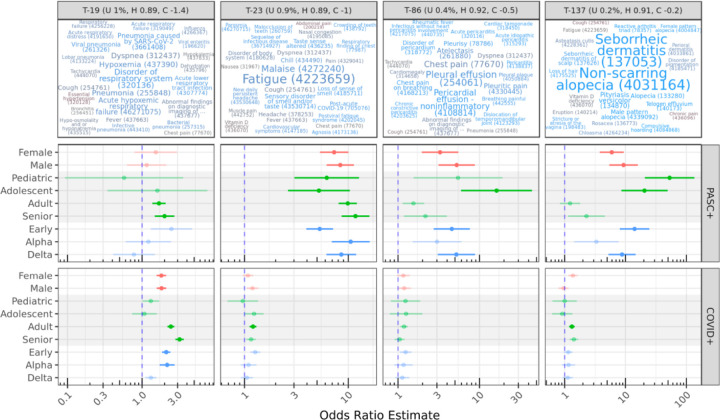
Figure 4: Topics with significant OR estimates >2 for at least two demographic groups.
The top row illustrates topics using the same color and size scales as Figure 2; OR estimates are shown for demographic-specific contrasts of PASC or COVID pre-vs-post odds ratios compared to similar Control odds ratios. For example, adult PASC patients increase odds of generating conditions from T-23 post-infection nearly 10 times more than Controls do over a similar timeframe (see Results). Lines show 95% confidence intervals for estimates; semi-transparent estimates are shown for context but were not significant after multiple-test correction.

