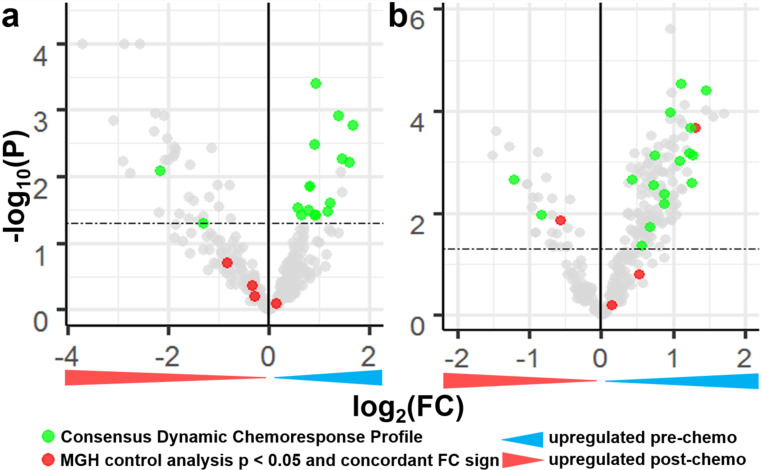
Figure 1.
Defining a consensus dynamic chemoresponse profile through miRNA differential expression analysis in the MGH and Longwood Datasets. a Volcano plot of paired differential miRNA expression between biopsy and resection samples from chemotherapy treated patients in the MGH dataset. b Volcano plot of paired differential miRNA expression between biopsy and resection samples from chemotherapy treated patients in the Longwood dataset. Dashed lines at p = 0.05.

