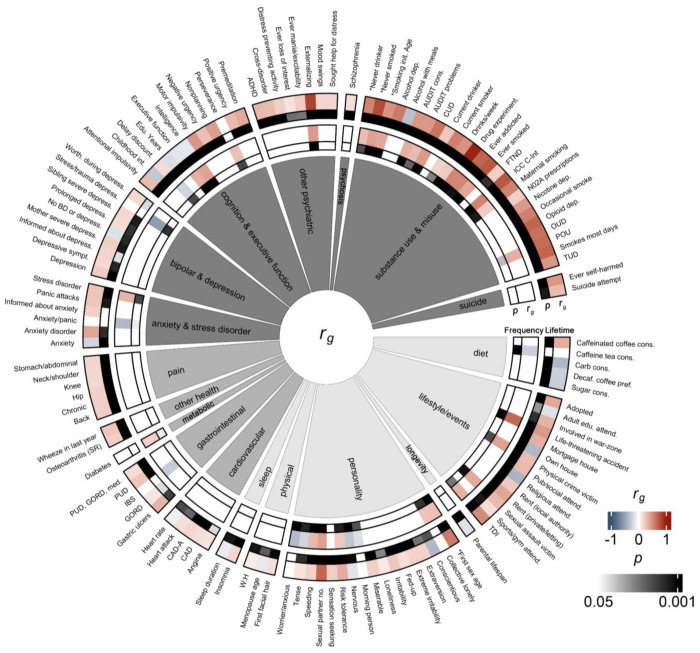
Figure 3.
Comparison of genetic correlations across anthropometric (light gray), health (medium gray), and psychiatric (dark gray) traits between lifetime cannabis use (lanes 1 and 2) and frequency of cannabis use (lanes 3 and 4). Lanes 1 and 3 show rg values calculated by LDSC, and lanes 2 and 4 show FDR-corrected p values. Only traits for which at least one cohort was FDR-significant are displayed. For a full list of correlations and trait names, see Supplementary Table 13. *reverse coded traits.

