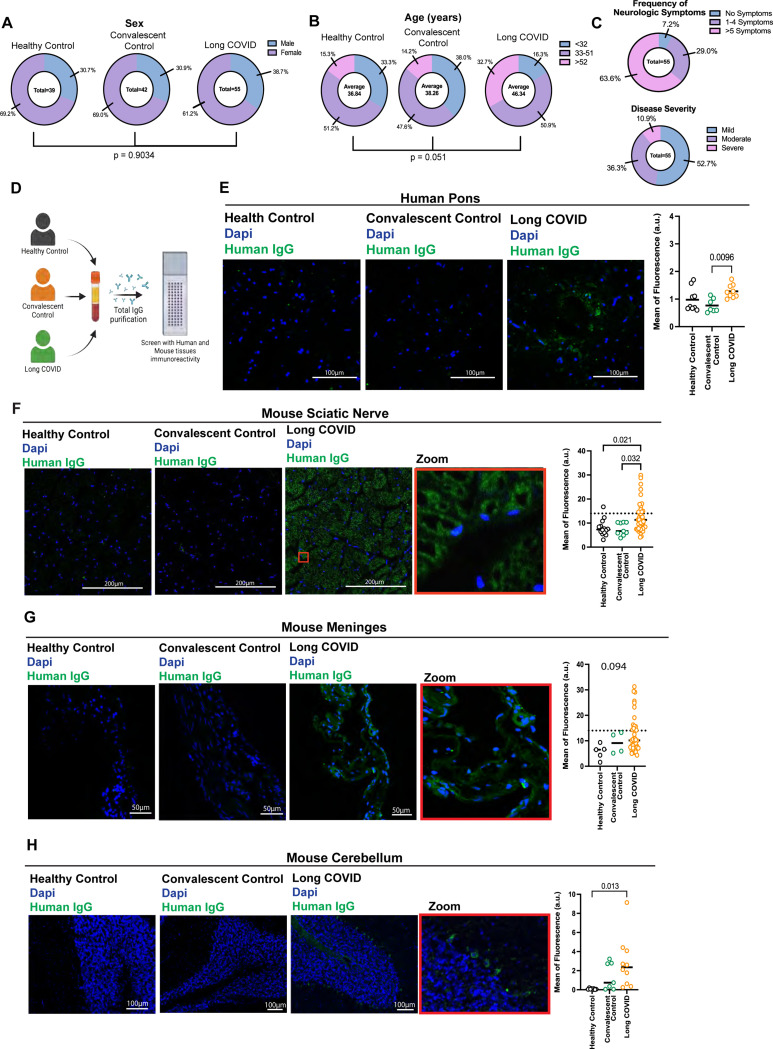
Figure 1. Purified IgG from participants with Long COVID reacts with CNS and PNS tissues.
A-C. Demographics (gender, age and symptoms) of biospecimens analyzed from MY-LC cohort. D-H. Confocal microscopy showing human and mouse tissues immunostained with human total IgG (green) purified from Long COVID, healthy or convalescent controls, as indicated, and nuclear DNA stain (DAPI, blue). D. Experiment schematic. C. Representative images of human pons immunostaining and Mean of fluorescence intensity. F. Representative images of mouse sciatic nerve immunostaining and mean of fluorescence. G. Representative images of mouse meninges immunostaining and mean of fluorescence. H. Representative images of mouse meninges immunostaining and mean of fluorescence. Scale bar described in the image. Insets indicate a higher magnification of a region indicated (red rectangle). Each dot in the figure represents the value obtained from an individual participant. Data are presented as the mean. Significant p-values are described in the image, as determined by One-way ANOVA with Tukey multiple comparisons test.

