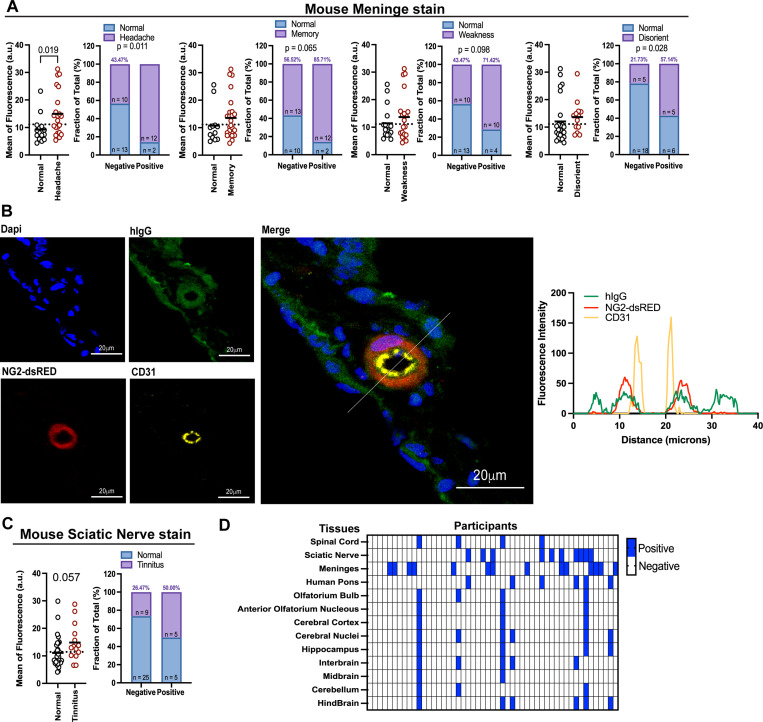
Figure 2. IgG from participants with long COVID that reacts to meninges and sciatic nerve are associated with symptoms.
A. Mouse meninges stain divided by symptoms displayed by the participants, as headache, memory, weakness and disorientation. B. Confocal microscopy showing meninge from NG2-dsRED mouse stained with total IgG from Long COVID participant (green) and CD31 (yellow), NG2-dsRED stains in red, nuclear DNA stain in blue (Dapi). Line scan analysis showing fluorescent intensity for hIgG, CD31 and NG2-dsRED. White line indicates the scan analysis in the graph. Scale bar described in the image. C. Mouse sciatic nerve stain divided by symptoms displayed by the participants, as tinnitus. D. Heatmap showing positive stain pattern across different tissues between participants, each collum is a different participant, each row is a different tissue. Each dot in the figure represents the value obtained from an individual participant. Data are presented as the mean. Significant p-values are described in the image, as determined by One-way ANOVA with Tukey multiple comparisons test.

