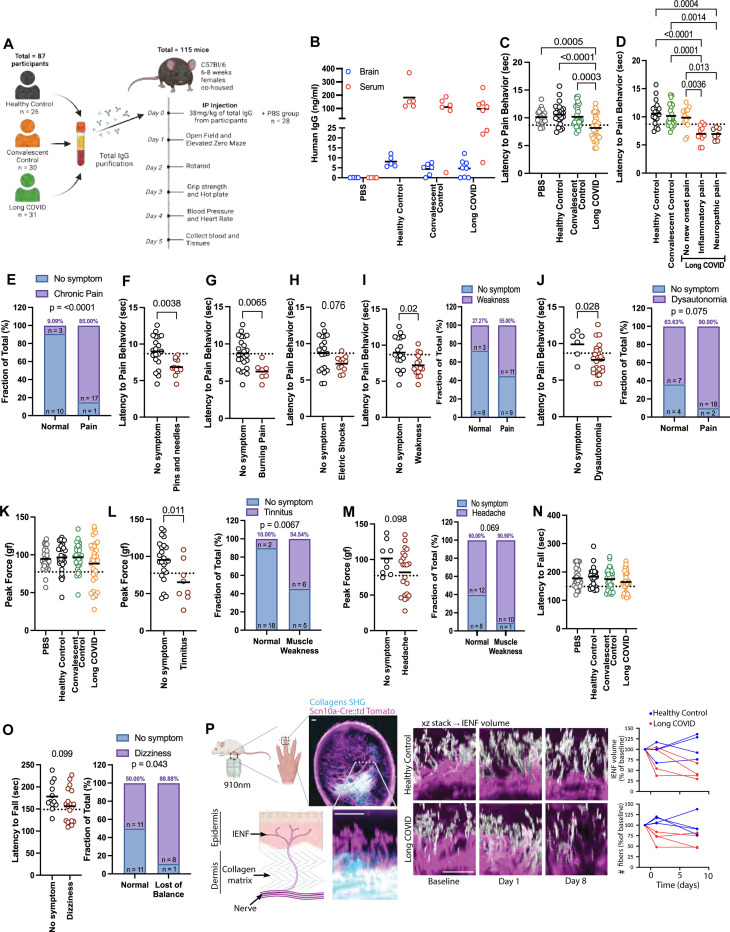
Figure 4. IgG from individuals with LC induces symptoms in mice.
A A dose of 38 mg/kg of total IgG purified from healthy, convalescent controls and Long COVID participants were administered to 6–8 weeks-old C57BL/6 female mice by intraperitoneal (IP) injection, which were followed up for 5 days. B Quantification of human IgG by ELISA in brain homogenate and serum at day 5 post-injection. C Hot plate test performed on day 3 post injection. D Hot plate test divided by status of chronic pain displayed by the participants. E Frequency of mice with pain at the hot plate test and the patients with diagnosed chronic pain. F-H Hot plate test divided by how the participants described their pain sensation. I Hot plate test divided by participants that displayed weakness. J Hot plate test divided by participants that displayed dysautonomia. K Grip strength test performed on day 3 post injection. L Grip strength test divided by participants that displayed tinnitus. M Grip strength test divided by participants that displayed headache. N Rotarod test performed on day 2 post injection. O Rotarod test divided by participants that displayed dizziness. P Longitudinal Two-photon imaging of Scn10a-Cre::td Tomato reporter mice reveals collagen fibers by second harmonic generation (SHG) as well as nociceptor axons and the perpendicular intraepidermal nerve fibers (IENF; white/pink). Quantification of total IENF volume and number of fibers crossing the dermis boundary after passive transfer. Scale bars 50μm. Each dot in the figure represents the value obtained from an individual mouse. Each mouse received antibodies isolated from a single human participant. Data are presented as the mean. Significant p values are described in the image, as determined by T-test for two groups comparison or one-way ANOVA corrected for multiple comparisons with Tukey test for multiple groups comparison.

