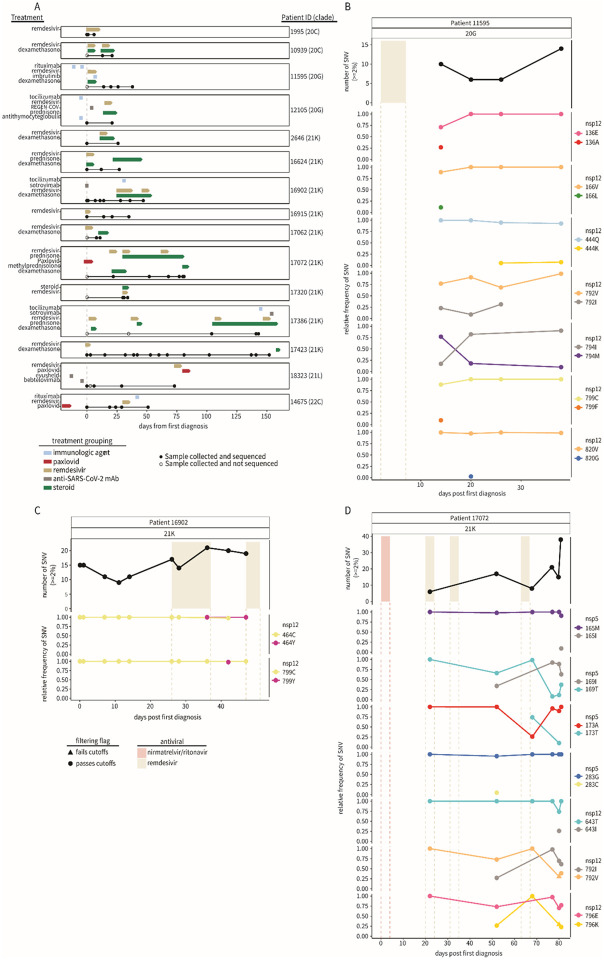
Fig. 1: Emergence of SARS-CoV-2 variants in immunocompromised patients.
A) The treatment course and sample collection from 15 patients with persistent SARS-CoV-2 infections. All time points along the x-axis are referenced from the date of each patient’s initial positive COVID-19 test result, with day 0 marking the date of the first positive test at the NY Presbyterian hospital (dashed gray line). Treatment courses are specified along the y-axis for each patient and colored based on the treatment category. Nasopharyngeal swab samples successfully sequenced and used for analyses are represented as black points along the solid black line for each patient. The number of unique single-nucleotide variants found ≥2% (top) over the course of the infection in patients (B) 11595, (C) 16902, and (D) 17072 compared to their treatment courses with nirmatrelvir-ritonavir (red) or remdesivir (tan). The relative frequency of SARS-CoV-2 single-nucleotide variants in nsp5 and nsp12 coding regions during infection are shown below. Variant data are grouped by the coding region and amino acid position, with the color representing the amino acid and the shape indicating whether the variant was found above (passes, circle) or below (fails, triangle) our detection cutoffs (methods). All time points along the x-axis are referenced from the date of each patient's initial positive COVID-19 test result, with day 0 marking the date of the first positive test at the NY Presbyterian hospital.

