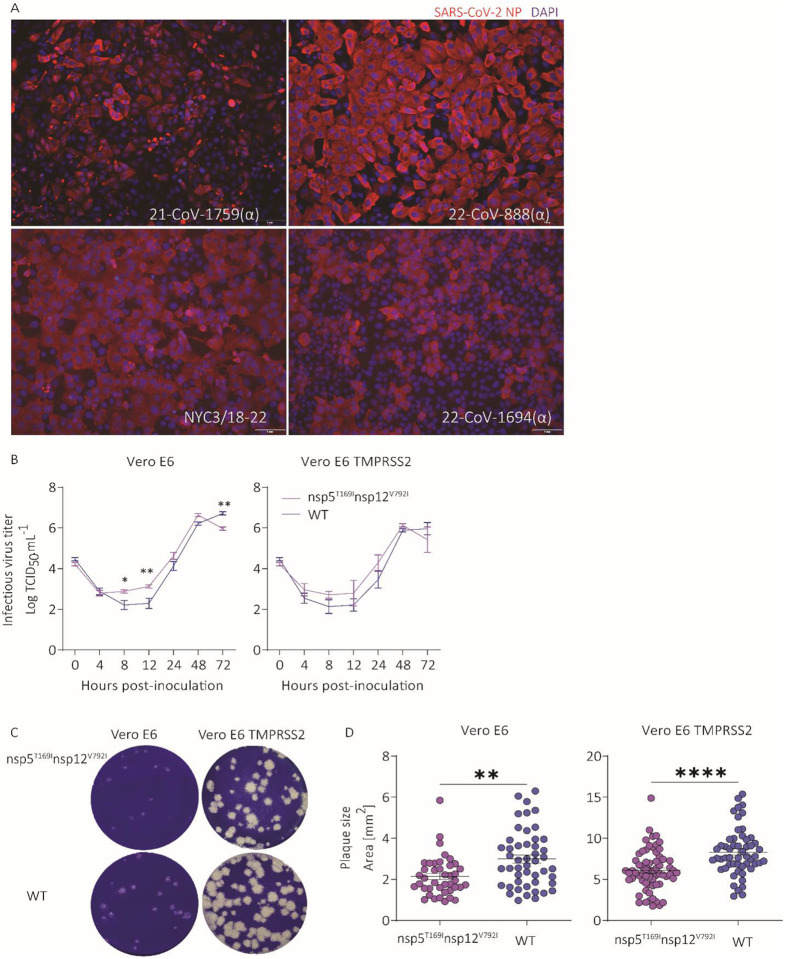
Extended Data Fig. 1: Isolation, growth kinetics and plaque size morphology of SARS-CoV-2 isolates.
A) Immunofluorescence images confirming the isolation of SARS-CoV-2 isolates from patient samples. Vero E6 TMPRSS2 cells were infected with SARS-CoV-2 isolates (MOI 0.1). After 48 hours, the cell monolayer was fixed and stained with SARS-CoV-2 NP specific monoclonal antibody (red) and counterstained with DAPI (blue). (B) Viral growth kinetics. Vero E6 and Vero E6 TMPRSS2 cells were infected (MOI 0.1) with SARS-CoV-2-nsp5T169Insp12V792I and WT viruses and virus titers were determined at indicated time points by limiting dilution method and expressed as TCID50.mL−1. Data indicates mean ± SEM, n = 3, three independent experiments. 2-way ANOVA followed by multiple comparisons test, * p < 0.05 and ** p < 0.01. (C) Viral plaque phenotype. Vero E6 and Vero E6 TMPRSS2 cells were infected (30 plaque forming unit/well) with SARS-CoV-2-nsp5T169Insp12V792I and WT isolates and overlaid with medium containing agar. Plates were incubated at 37 °C for 72 h, the agar overlay was removed, cells were fixed, and the monolayer was stained with 0.5% crystal violet. (D) The diameters of viral plaques from Figure C were measured using a scale in millimeters. Number of plaques measured for Vero E6 cells were SARS-CoV-2-nsp5T169Insp12V792I (n=41) and WT (n=48), and for Vero E6 TMPRSS2 cells were SARS-CoV-2-nsp5T169Insp12V792I (n=65) and WT (n=54). Three independent experiments. Mann-Whitney U test, **p < 0.01 and ****p < 0.0001.

