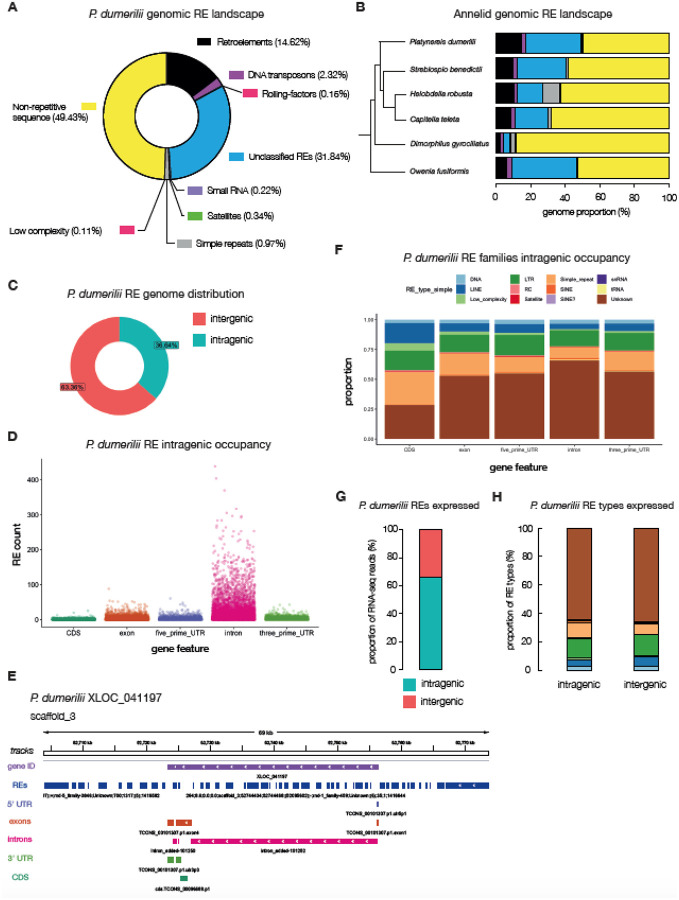
Figure 3. The repeat-element landscape in P. dumerilii.
A, a doughnut plot illustrating the percentages of repeat and non-repeat elements found in the P. dumerilii genome. Percentages are of the total assembly (i.e. 49.43% of the entire genome is annotated as non-repetitive; yellow). B, annelids – whose relationships are shown in a phylogenetic tree – genomic repeat-element landscape. C, the distribution of intra – vs – inter-genic P. dumerilii repeat elements. D, counts of repeat elements represented as scatterplots within annotated intragenic regions of the P. dumerilii genome. E, an example gene locus (XLOC_041197) and its flanking regions on scaffold_3 highlighting repeat-element tracks (dark-blue) with the 5’ and 3’ UTRs (light-purple and green tracks respectively), exons (dark-orange track), introns (pink tracks) and the CDS (green tracks). F, proportion of repeat-element families and their occupancy at different intragenic regions. G, proportion of repeat-element specific RNA-seq reads mapping to intra – vs – inter-genic sites in P. dumerilii. H, proportion of RNA-seq reads mapping to intra – vs – inter-genic sites within specific RE types, colored according to the same legend in panel F.

