
Figure 4. The protein coding repertoire in annelids.
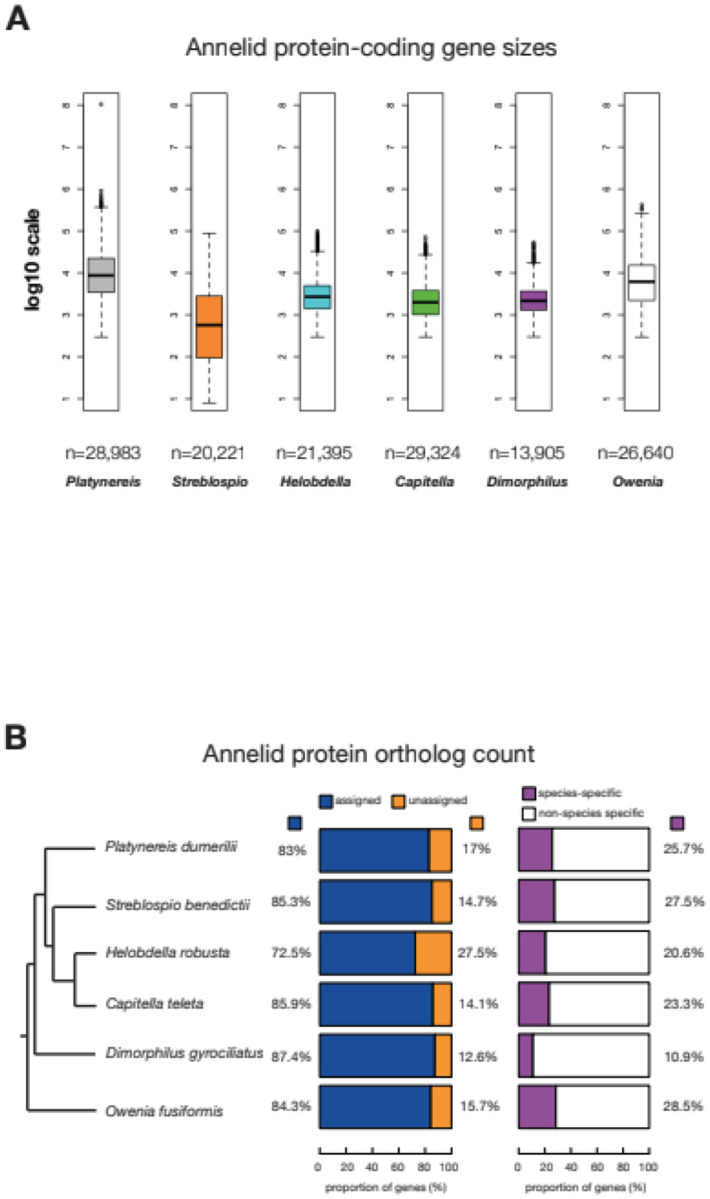
A, Annelid protein coding gene sizes plotted in log10 scale. The n values represent the total number of protein-coding genes that were measured for gene size, spanning the actual gene locus i.e. exons, introns and UTRs. The longest isoforms per gene were selected for the analysis. B, Proportion of annelid protein-coding genes in orthogroups.