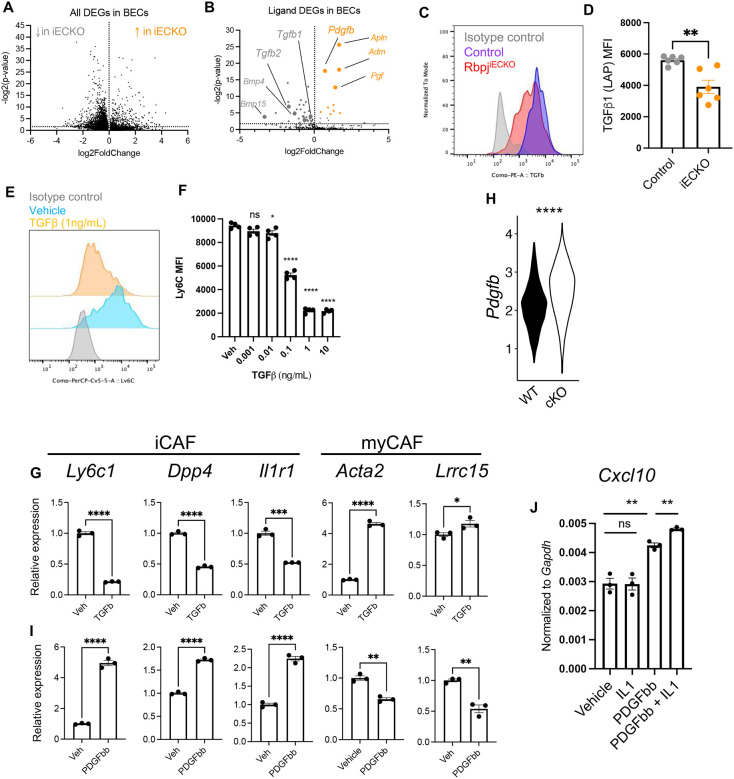
Figure 4. Abrogation of endothelial Notch modulates angiocrine PDGFβ and TGFβ to reprogram CAFs.
A. Volcano plot from scRNAseq analyses of differentially expressed genes (DEGs) in BECs of KP1 tumors in control and RbpjiECKO mice (p<0.01).
B. Volcano plot of DEGs from (A) filtered by the GO term “ligand-receptor interactions”.
C-D. Representative flow cytometric staining (C) and MFI quantification (D) of pro-TGFβ1 intracellular in BECs of orthotopic KP1 tumors from control and RbpjiECKO mice.
E-F. Representative Ly6C staining (E) and Ly6C MFI quantification (F) on ex vivo CAFs treated with vehicle (PBS) or recombinant murine TGFβ at indicated doses. Analyses were done after 24 hours of culture. Representative of 3 independent experiments.
G. QPCR analyses of iCAF and myCAF gene on ex vivo CAFs treated with vehicle (PBS) or recombinant murine TGFβ (1ng/mL). Data were normalized to the average of vehicle-treated samples. Representative of 3 independent experiments.
H. Violin plot of Pdgfb expression in BECs from KP1 tumors of control and RbpjiECKO mice by scRNAseq.
I. QPCR analyses of iCAF and myCAF gene on ex vivo CAFs treated with vehicle (PBS) or recombinant murine PDGFββ (10ng/mL). Representative of 3 independent experiments.
J. QPCR analyses of Cxcl10 in CAFs treated with recombinant murine PDGFββ (10ng/mL) and/or IL1 (10ng/mL) for 24 hours. Representative of 3 independent experiments.
* p<0.05, ** p<0.01, *** p<0.001, **** p<0.0001 by student’s t-tests. ns denotes not significant.

