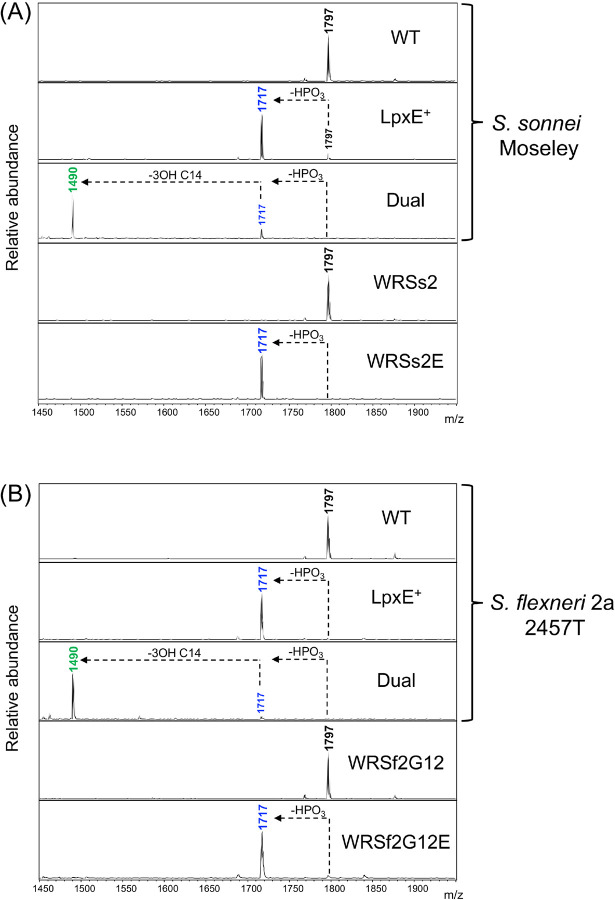
Figure 2: MALDI-TOF MS analysis of lipid A related peaks for BECC-modified Shigella strains.
Representative MALDI-TOF MS spectra for WT and vaccine strains of (A) S. sonnei and (B) S. flexneri 2a chromosomally expressing lpxE or Dual. Spectral peaks represent [M-H]− ions. Colored peaks correspond to the expected structures detailed in Figure 1. Arrows depict the loss of a phosphate (HPO3) or acyl chain (3OH C14) from the indicated lipid A species.

