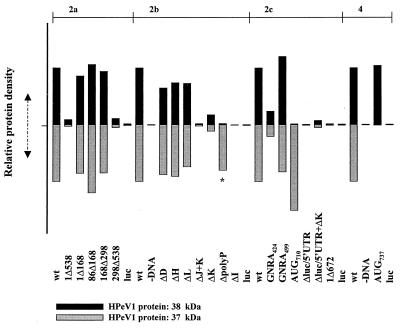
FIG. 3.
Densitometric analysis of coupled in vitro transcription-translation reactions. The translation efficiency for each sample in Fig. 2 was measured by scanning four times in different directions and taking the mean value. The two HPeV1 proteins in each sample were normalized according to the intensity of the corresponding luciferase cistron. Intensities were then expressed relative to the intensity of the protein products of the wild-type construct loaded onto each gel. 2a, 2b, 2c, and 4 refer to figures showing the gels from which the data were derived. Black bars represent the relative intensity of the 38-kDa protein compared to that in the wild-type track, while the grey bars refer to the relative intensity of the 37-kDa protein. The ΔpolyP bar is labeled ∗ to indicate that although similar in size to the 37-kDa product, it is slightly smaller.

