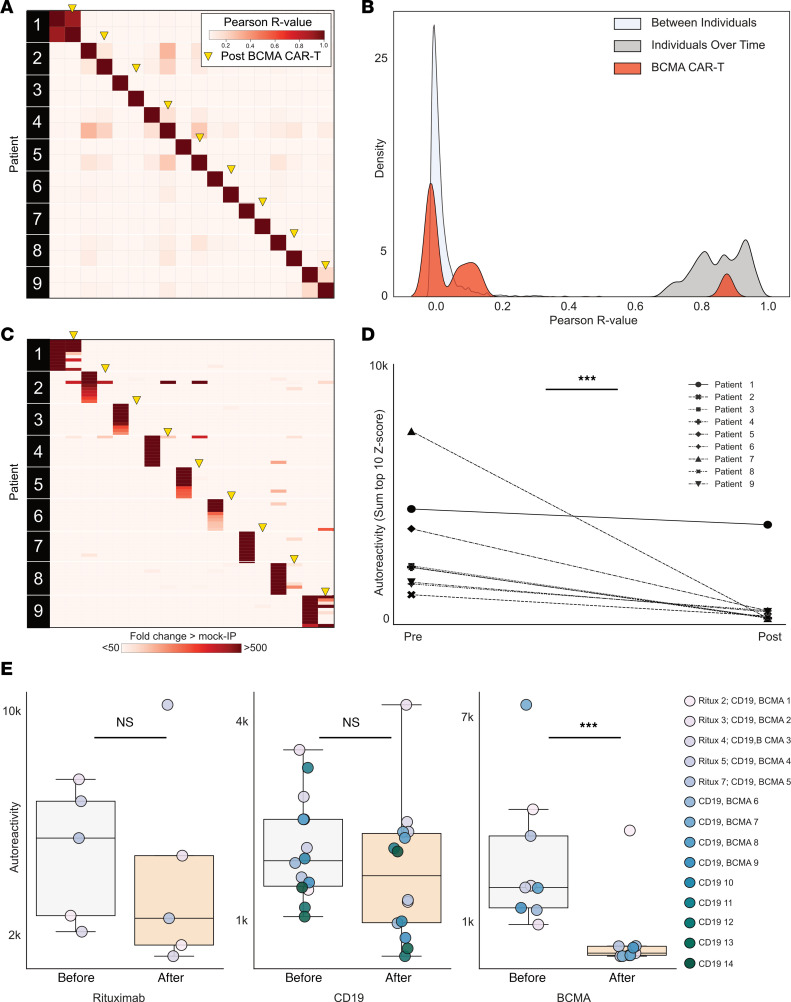
Figure 4. Anti-BCMA CAR T cell therapy significantly alters the autoreactome.
(A) Correlation matrix showing Pearson’s r values of complete PhIP-Seq signal in 9 distinct individuals before and after anti-BCMA CAR T cell therapy. Yellow arrows represent the 6-month posttreatment time point. (B) Kernel density estimate plot showing distribution of correlation coefficients within each individual before and after BCMA-targeted therapy relative to the distribution among untreated individuals over time and the distribution between different individuals. (C) Heatmap showing top 10 autoreactivities (sum of top 10 PhIP-Seq Z scores relative to the 79 individuals acting as healthy controls) in each individual before and after treatment. (D) Line plots showing the autoreactivity (sum of top 3–12 PhIP-Seq Z scores relative to the 79 healthy controls, therefore accounting for potential paraprotein confounding) for each patient before and after treatment. One-sided paired-sample Wilcoxon’s test, P = 0.0019. (E) Box plots showing the relative distributions of autoreactivity before and after treatment with rituximab (sum of top 10), anti-CD19 CAR T cell therapy (sum of top 10), and anti-BCMA CAR T cell therapy (sum of top 3 through 12 autoreactivities). Anti-BCMA CAR T cell treatment cohort, Mann-Whitney U, P = 0.42, with a median percentage decrease of 52.3%; anti-CD19 CAR T cell treatment cohort, Mann-Whitney U, P = 0.206, with a median percentage decrease of 11.9%; and anti-BCMA CAR T cell treatment cohort, Mann-Whitney U, P = 0.003, with a median percentage decrease of 95.6%. ***P < 0.005.

