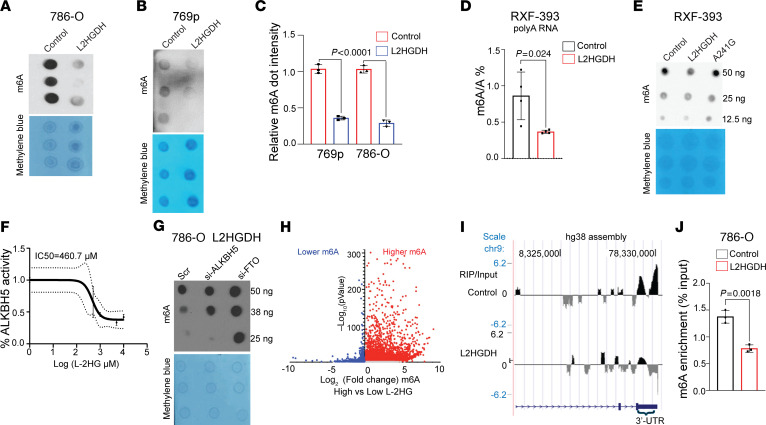
Figure 3. l-2HG promotes mRNA m6A methylation in RCC.
(A and B) m6A dot blot of 100 ng mRNA isolated from 786-O (A) and 769p (B) cells (n = 3, biological replicates) stably expressing control vector or L2HGDH (WT). Methylene blue blot serves as loading control. (C) Quantification of m6A normalized to methylene blue as shown in A and B. Data are shown as mean ± SD from n = 3 biological replicates. (D) LC-MS/MS analysis of m6A levels in mRNA from RXF-393 cells stably expressing control vector or L2HGDH. Data are presented as ratio of m6A to unmodified adenosine (m6A/A). Data are shown as mean ± SD from n = 4 biological replicates. (E) m6A dot blot of mRNA isolated from RXF-393 cells stably expressing control vector, L2HGDH WT, or L2HGDH mutant (A241G). (F) In vitro ALKBH5 activity with increasing concentration of l-2HG. Each data point represents mean ± error values of n = 2 technical replicates. (G) 786-O cells stably transduced with L2HGDH cDNA were transiently treated with scramble siRNA (Scr) or siRNAs targeting ALKBH5 and FTO (52 hours). mRNA was harvested and assessed for m6A via dot blot. (H) Volcano plot of m6A-Seq demonstrating relative changes in m6A peaks in mRNAs isolated from high–l-2HG control versus low–l-2HG (L2HGDH-transduced) 786-O cells n = 1 each. Red denotes higher m6A levels in high l-2HG levels. Blue denotes lower m6A levels in high l-2HG levels. (I) m6A-Seq analysis of the PSAT1 mRNA from 786-O control (high–l-2HG) and L2HGDH (low–l-2HG) cells. For each condition, enrichment is displayed as RNA m6A-immunoprecipitated (RIP) normalized to the corresponding input. (J) m6A immunoprecipitation RT-qPCR was used to assess m6A enrichment in the PSAT1 3′-UTR from 786-O cells stably transduced with the indicated vector. PSAT1-1F/1R primer pair was used. Data are represented as mean ± SD from n = 3 biological replicates.

