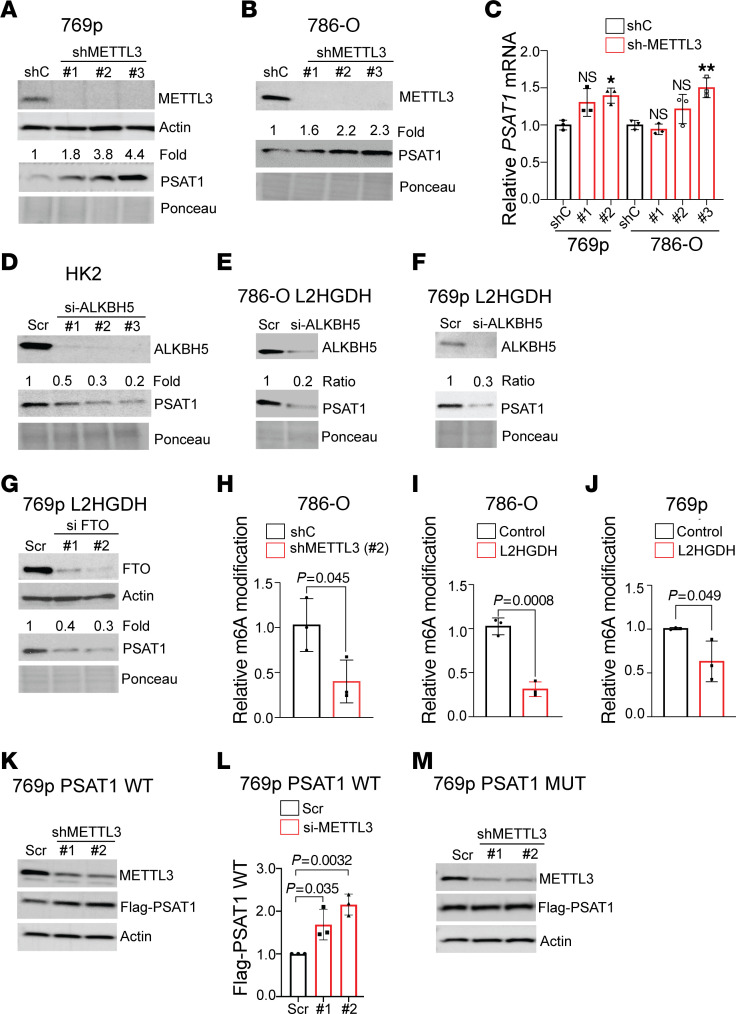
Figure 4. Regulation of PSAT1 expression through l-2HG–induced m6A.
(A and B) Immunoblot of METTL3 and PSAT1 from 769p (A) and 786-O (B) cells stably expressing the indicated shRNA (shC, control shRNA). Actin and Ponceau serve as loading control. Relative PSAT1 was normalized to Ponceau. (C) RT-qPCR analysis of PSAT1 mRNA expression (normalized to RPLPO) from 786-O and 769p cells stably expressing control shRNA (shC) or METTL3-targeting shRNA. Data are represented as mean ± SD from n = 3 biological replicates. *P < 0.05, **P <0.005. (D) Immunoblot of ALKBH5 and PSAT1 from HK-2 renal epithelial cells transiently transfected (52 hours) with scramble siRNA (Scr) or siRNAs targeting ALKBH5 (#1, #2, #3). Relative PSAT1 was determined by normalizing to Ponceau loading control. (E and F) Immunoblot of ALKBH5 and PSAT1 from 786-O/L2HGDH (E) and 769p/L2HGDH (F) cells transiently transfected (52 hours) with the indicated siRNA Scr, scramble siRNA. Relative PSAT1 was normalized to Ponceau. (G) Immunoblot of FTO and PSAT1 from 769p/L2HGDH cells transiently transfected (52 hours) with the indicated siRNA. Relative PSAT1 was normalized to Ponceau. (H–J) Relative m6A by SELECT at the GGACT site within the PSAT1 3′-UTR. (H) Relative m6A in 786-O cells transduced with control shRNA shC or shMETTL3. (I and J) Relative m6A levels in 786-O (I) and 769p (J) cells transduced with vector control or L2HGDH. Data are shown as mean ± SD from n = 3 biological replicates. (K and L) 769p cells were stably transduced with FLAG-tagged PSAT1 (WT) construct. Cells were transiently transfected (52 hours) with the indicated siRNA followed by immunoblotting (K). (L) Quantitative densitometry of FLAG levels normalized to actin. Data are represented as mean ± SD from n = 3 biological replicates. ANOVA was used, and Tukey’s post hoc P values are shown. (M) 769p cells were stably transduced with FLAG-tagged PSAT1 (MUT) construct. Cells were transiently transfected (52 hours) with the indicated siRNA followed by immunoblotting.

