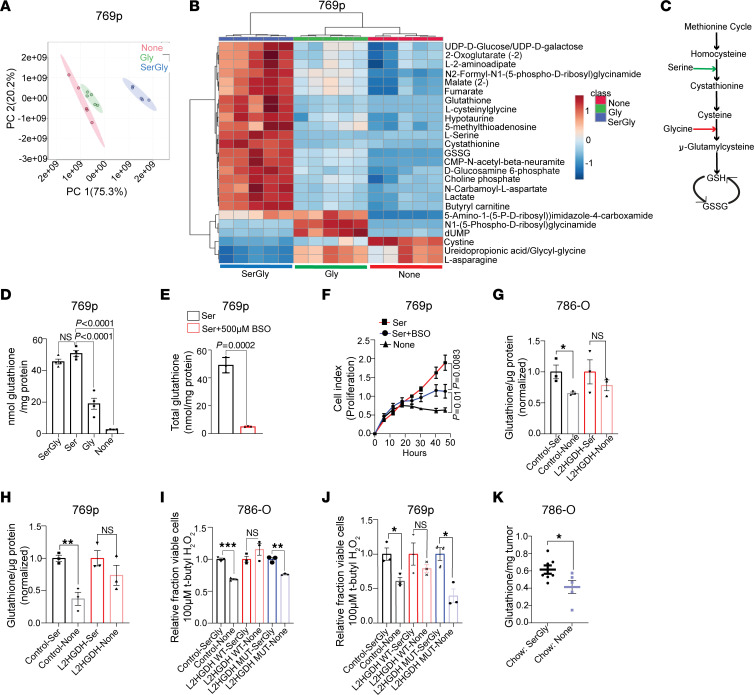
Figure 6. Exogenous serine is required for glutathione synthesis in RCC.
(A) Principal component plot from partial least-squares discriminant analysis of metabolites from 769p cells grown in media containing both serine and glycine, glycine only, or no serine and glycine (None) (n = 5 biological replicates per group). (B) LC-MS analysis of metabolites extracted from the 3 groups of 769p cells described in A. (C) Schematic view of serine and glycine incorporation into glutathione (GSH). (D) Analysis of cellular GSH levels from 769p cells cultured for 24 hours in media as indicated. Results are presented as mean ± SEM from n = 4 biological replicates of each group. ANOVA P value < 0.0001. Post hoc Tukey’s P values are shown. (E) Analysis of cellular GSH levels from 769p cells cultured for 24 hours in serine-containing media with or without BSO. Data are presented as mean ± SD from n = 3 biological replicates per group. (F) Cell proliferation as determined by connectivity index in 769p cells grown as indicated. Each data point represents mean ± SD from n = 4 biological replicates of each group. (G and H) GSH levels of 786-O (G) and 769p (H) cells stably expressing control vector or L2HGDH and cultured for 24 hours in media with or without (None) serine. Data are shown as mean ± SEM from n = 3 biological replicates in each group. *P < 0.05, **P < 0.005. (I and J) Relative fraction of viable cells in 786-O (I) and 769p (J) cells stably expressing the indicated vector and treated with 100 mM tert-butyl H2O2 for 24 hours in the presence or absence of SerGly. Results are presented as mean ± SEM from n = 3 biological replicates of each group. *P < 0.05, **P < 0.005, ***P < 0.0001. (K) Quantification of GSH content in 786-O xenografts in mice fed chow with or without SerGly. Xenografts are from data presented in Figure 5M. Results are presented as mean ± SEM. *P < 0.05.

