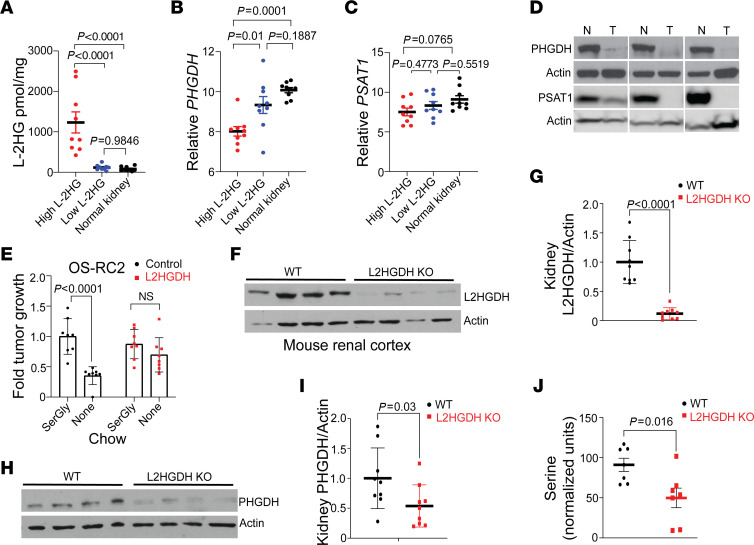
Figure 7. Translational relevance of raised l-2HG in RCC.
(A) LC-MS analysis of l-2HG content (normalized to total protein content) from patient tissues harvested from normal kidneys (black dots), high–l-2HG tumors (red dots), or low–l-2HG tumors (blue dots). Data are presented as mean ± SEM from n = 9 samples. Data were analyzed by 1-way ANOVA followed by post hoc Tukey’s honestly significant difference test. ANOVA P value < 0.0001 (F = 18.54). Post hoc analysis P values are shown. (B and C) mRNA expression of PHGDH (B) and PSAT1 (C) from the samples in A. Data are presented as mean ± SEM. Data were analyzed by 1 way ANOVA followed by post hoc Tukey’s honestly significant difference test. ANOVA P values for B and C are 0.0002 (F = 12.91) and 0.0932 (F = 2.624), respectively. Post hoc analysis P values are shown. (D) Immunoblot analysis of PHGDH and PSAT1 from patient-matched (n = 3) high–l-2HG tumors and adjacent normal kidney. The Western blot in the third PHGDH panel is the same blot with shorter exposure time. (E) Relative tumor size of OS-RC-2 xenografts (with or without L2HGDH) at 4 weeks in mice fed chow with or without SerGly. After average tumor size reached 100 mm3, mice were randomly distributed into 2 groups (n = 8 per group). Data are shown as mean ± SEM. (F and G) Immunoblot of L2HGDH protein (F) and densitometric quantification (G) in renal cortical tissue from WT and global-L2HGDH-KO mice. Data were normalized to actin. Data in G are presented as mean ± SEM. (H and I) PHGDH immunoblot and quantification from WT and L2HGDH-KO mouse renal cortical tissues. Data were normalized to actin. Data in I are presented as mean ± SEM. (J) Gas chromatography-MS analysis of serine from WT and global-L2HGDH-KO renal cortical tissues. Data are presented as mean ± SEM from n = 7 mice in each group.

