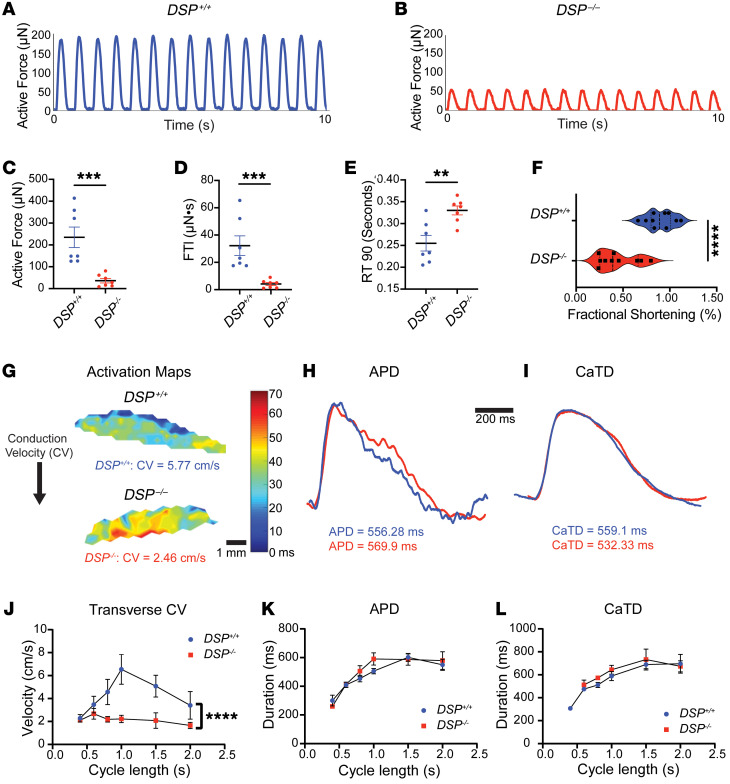
Figure 2. Mechanical and electrical defects in DSP–/– EHTs.
(A and B) Active force of DSP–/– and isogenic DSP+/+ control EHTs recorded at baseline. (C and D) Peak force and force time integral (FTI) were significantly reduced in DSP–/– EHTs compared with DSP+/+ EHTs. (E) The time to 90% force reduction from peak (RT 90) was prolonged in DSP–/– compared with DSP+/+ EHTs. (***< 0.001, **< 0.01 by Mann-Whitney U test; n = 7 DSP+/+ and n = 7 DSP–/–; data reflect 7 independent batches.) (F) Fractional shortening (FS) of DSP–/– EHTs was significantly reduced at baseline (****< 0.0001 by 2-tailed t test with Welch’s correction; n = 10 DSP+/+ and n = 10 DSP–/–; data reflect 3 independent batches). (G) Optical mapping of DSP+/+ and DSP–/– EHTs at cycle length of 1 second measuring transverse conduction velocity (CV) with representative action potential duration (APD) (H) and Ca2+ transient duration (CaTD) (I). (J–L) Restitution curves of DSP–/– and DSP+/+ EHTs demonstrated significant reduction of CV (J) with no difference in APD (K) and CaTD (L) across cycle lengths (****< 0.0001 by nonlinear regression analysis, n = 4–6 EHTs per condition across 3 batches). All data presented as mean ± SEM.

