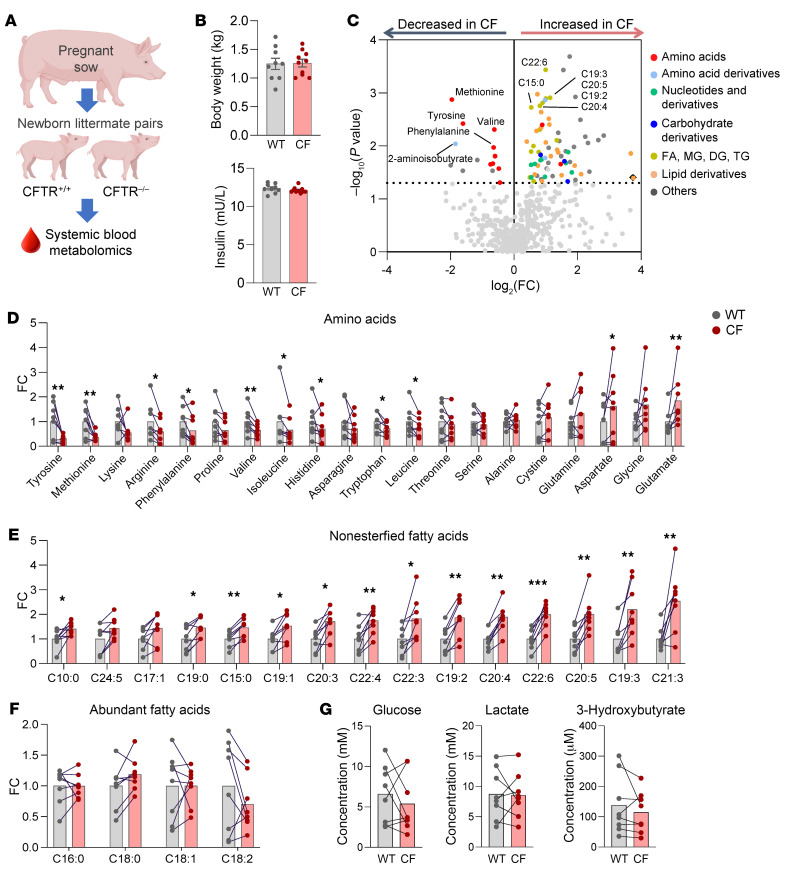
Figure 1. The circulating metabolome differs between WT and CF newborn pigs.
(A) Experimental scheme for systemic blood metabolomics using LC-MS. (B) Body weights and fasting serum insulin levels (mU/L). n = 9 WT and n = 10 CF pigs. (C) Volcano plot indicating the difference of each circulating metabolite between WT and CF pigs (color coded to indicate various metabolite categories). Representative metabolites enriched in WT or CF are marked. Fatty acid (FA); monoglyceride (MG); diglyceride (DG); triglyceride (TG). (D–G) Comparison of amino acids (D), fatty acids (E), and other abundant circulating metabolite (F and G) levels in blood between 8 WT and CF littermate pairs. *P < 0.05, **P < 0.01, and ***P < 0.001 relative to WT, by 2-tailed, paired Student’s t test for metabolites meeting normality or Wilcoxon signed-rank test for metabolites that do not meet normality (see Supplemental Table 1). Bars show the mean. FC, fold change (CF/WT).

